Observability Summit Europe 2026: OpenTelemetry Grows Up
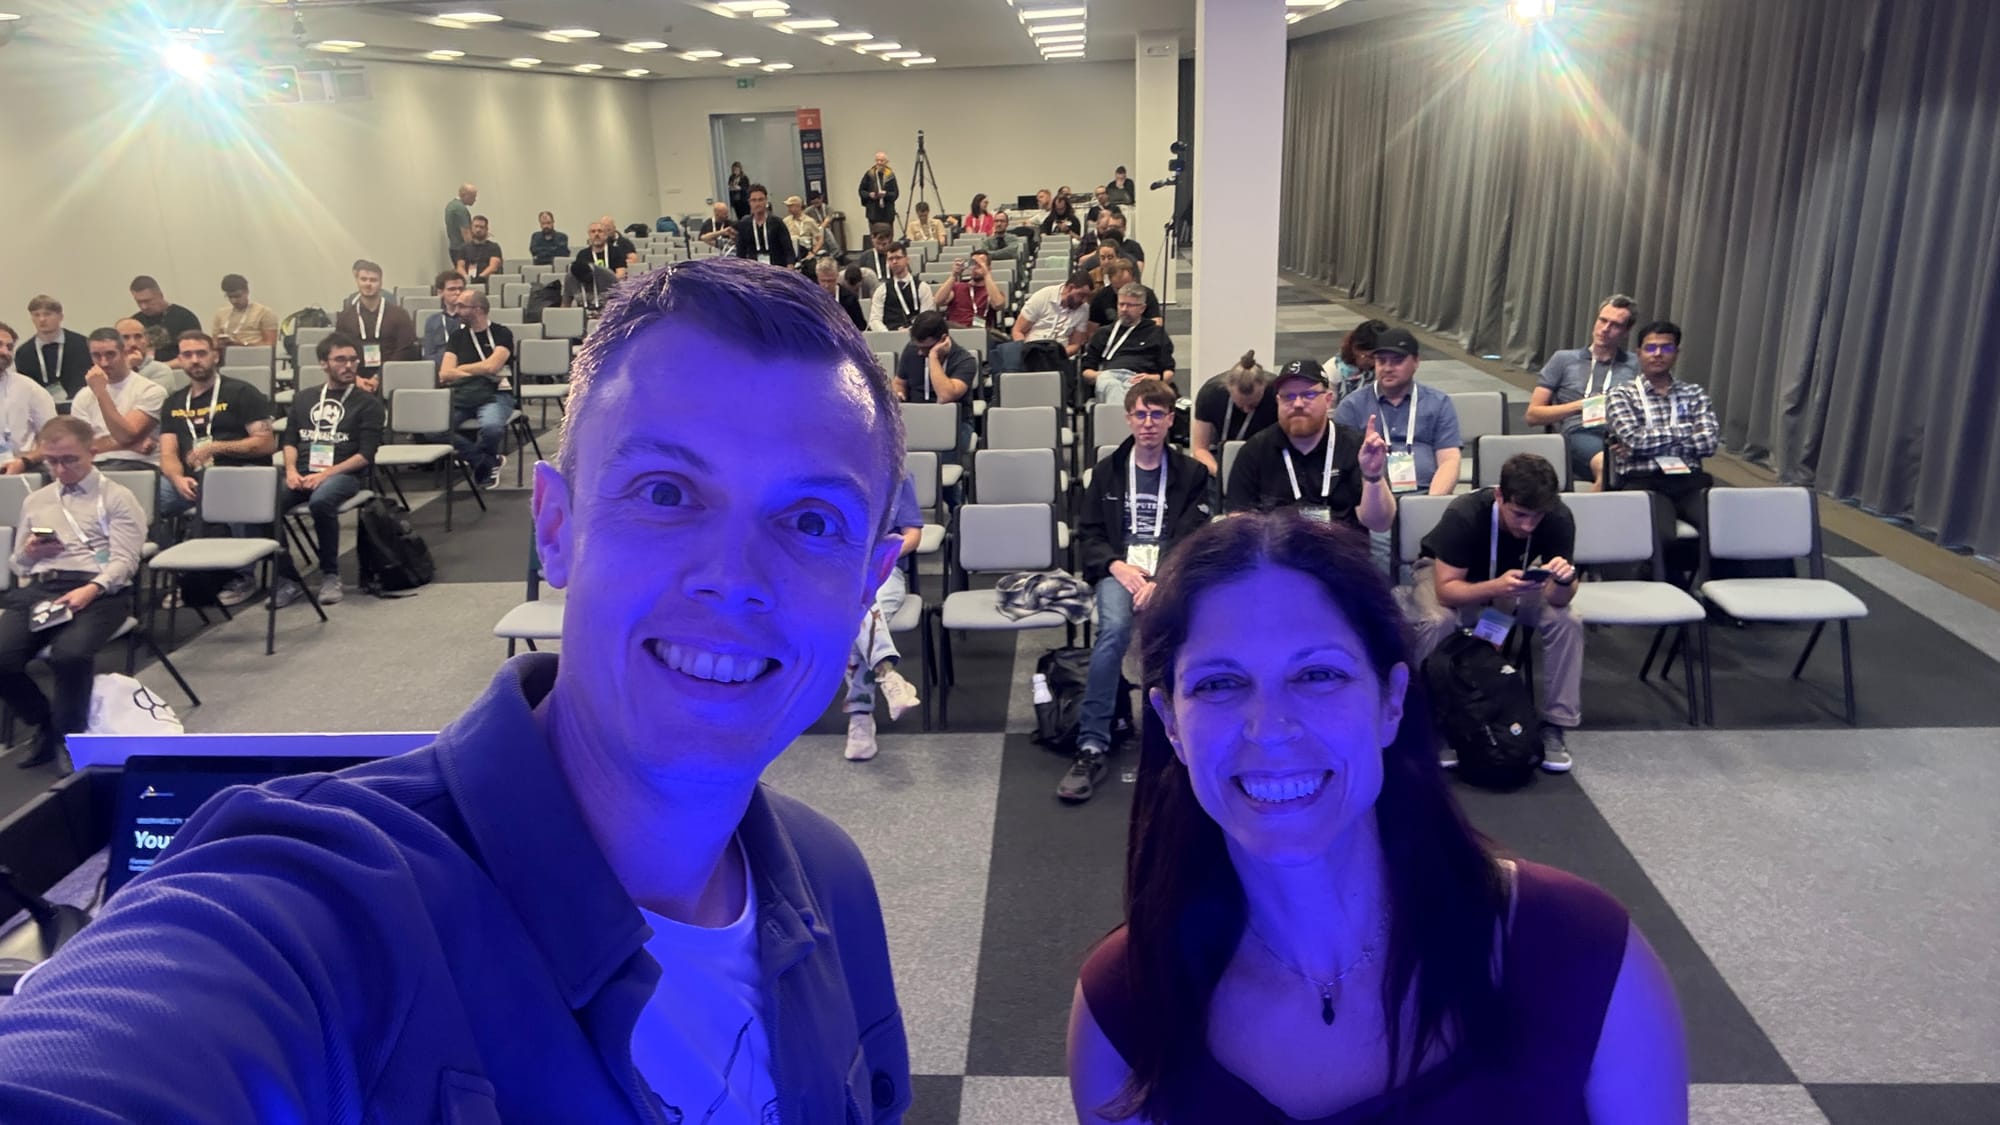
I almost didn’t make it to Prague. On Sunday, the day before, I was supposed to fly from Billund via Amsterdam. Instead I was rebooked, and spent the evening at the airport hotel in Billund before a 6am flight via Frankfurt on Monday morning. Luckily, Adriana Villela and I had the last slot of the day, so I arrived with a few hours to spare.
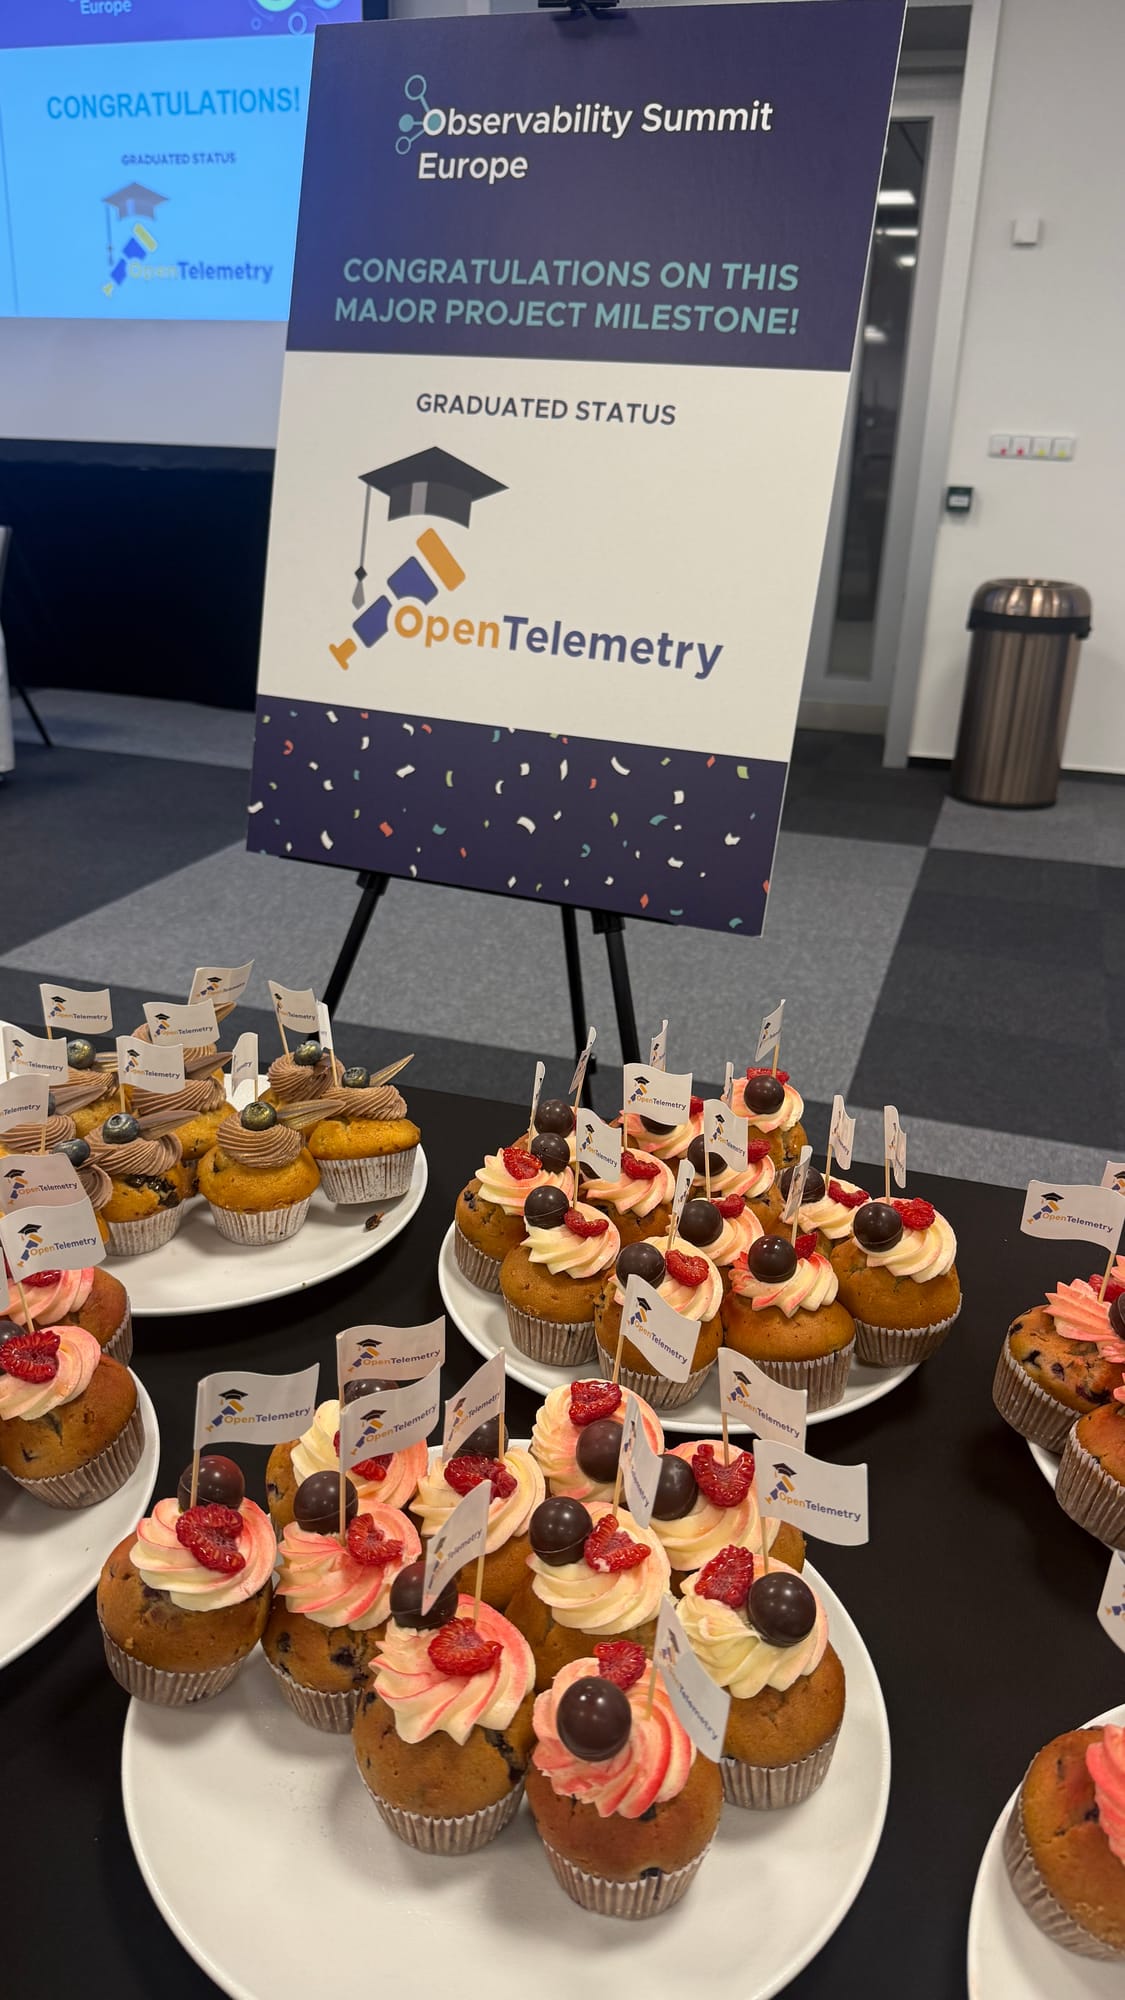
The day was the first Observability Summit Europe, co-located with Open Source Summit Europe at the Prague Congress Centre. OpenTelemetry graduated in the CNCF in May, and the organisers marked it with graduation cupcakes. They were delicious.
Graduation fit the talks I caught. Nobody was explaining what OpenTelemetry is. They were about what comes after hello world: running the Collector in production, keeping it stable when the schema underneath it changes, and choosing between agents with numbers rather than habit.
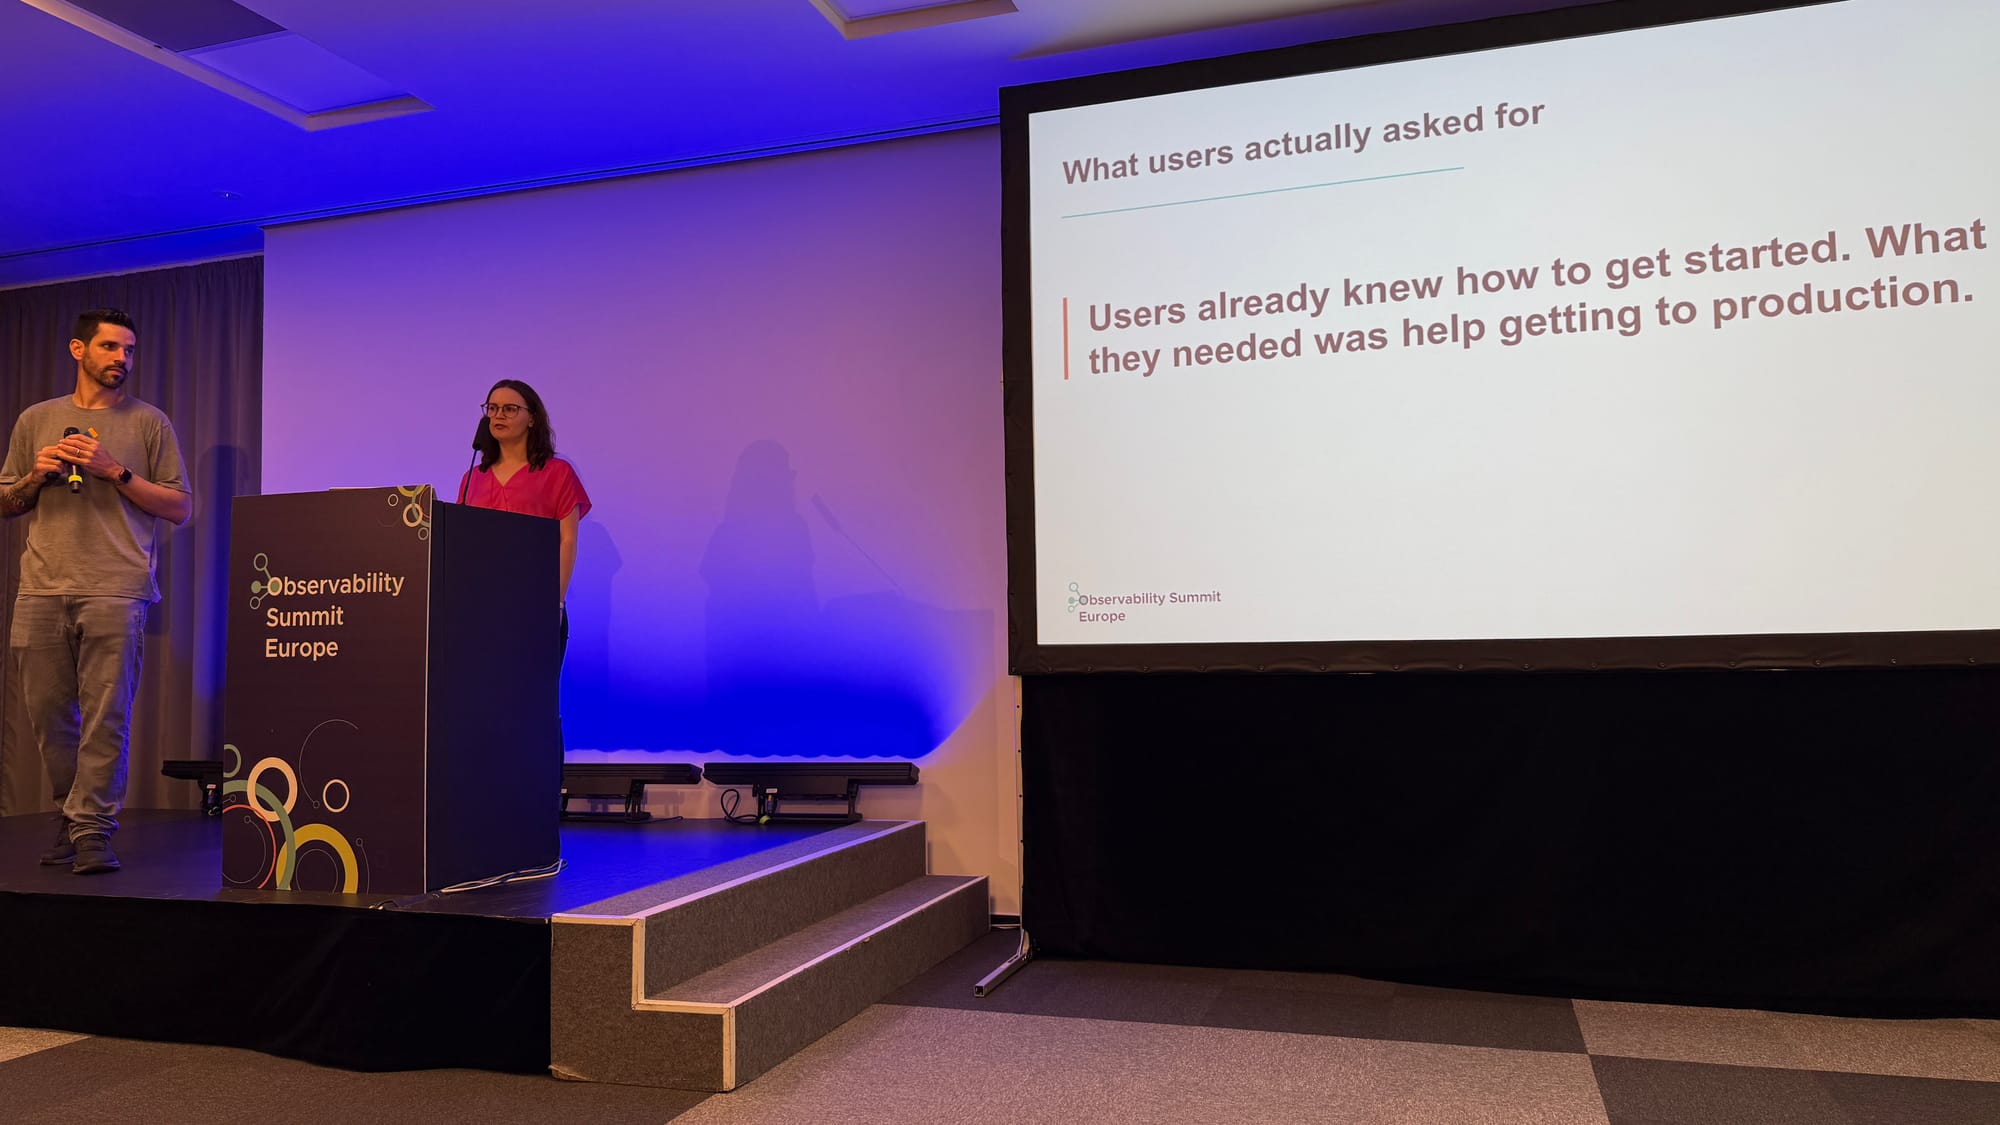
Users already know how to get started
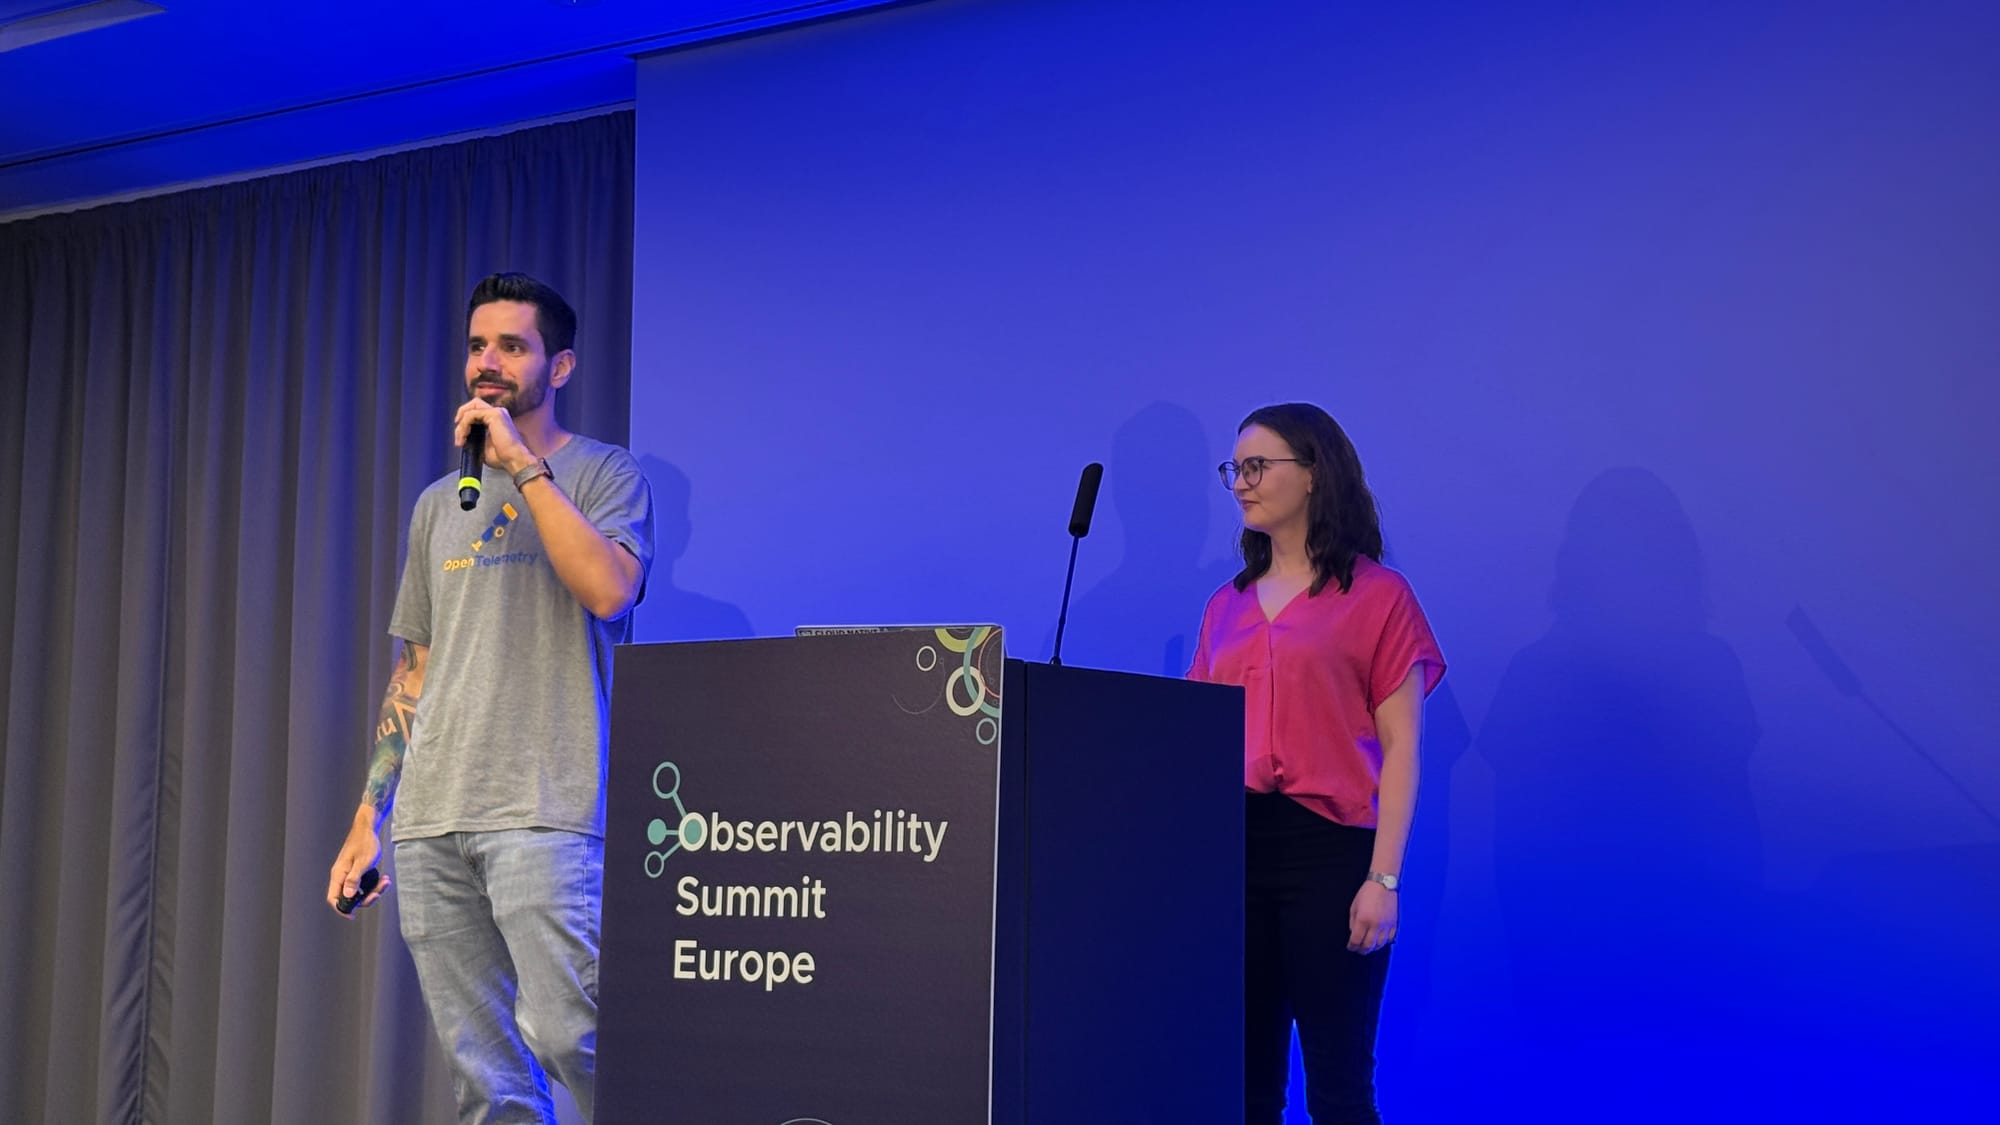
Juliano Costa and Johanna Öjeling maintain the OpenTelemetry Developer Experience SIG, and their talk, “What OpenTelemetry Users Taught Us About Developer Experience”, started with an assumption that turned out to be wrong. When the SIG started, they took developer experience to mean the SDKs: easier configuration, clearer APIs, smoother onboarding. They asked SDK maintainers where they diverge from the spec and what their users ask for, and got answers that were all different. PHP’s most requested feature was async exporting and a way to close dangling spans, but nothing applied across all the SIGs.
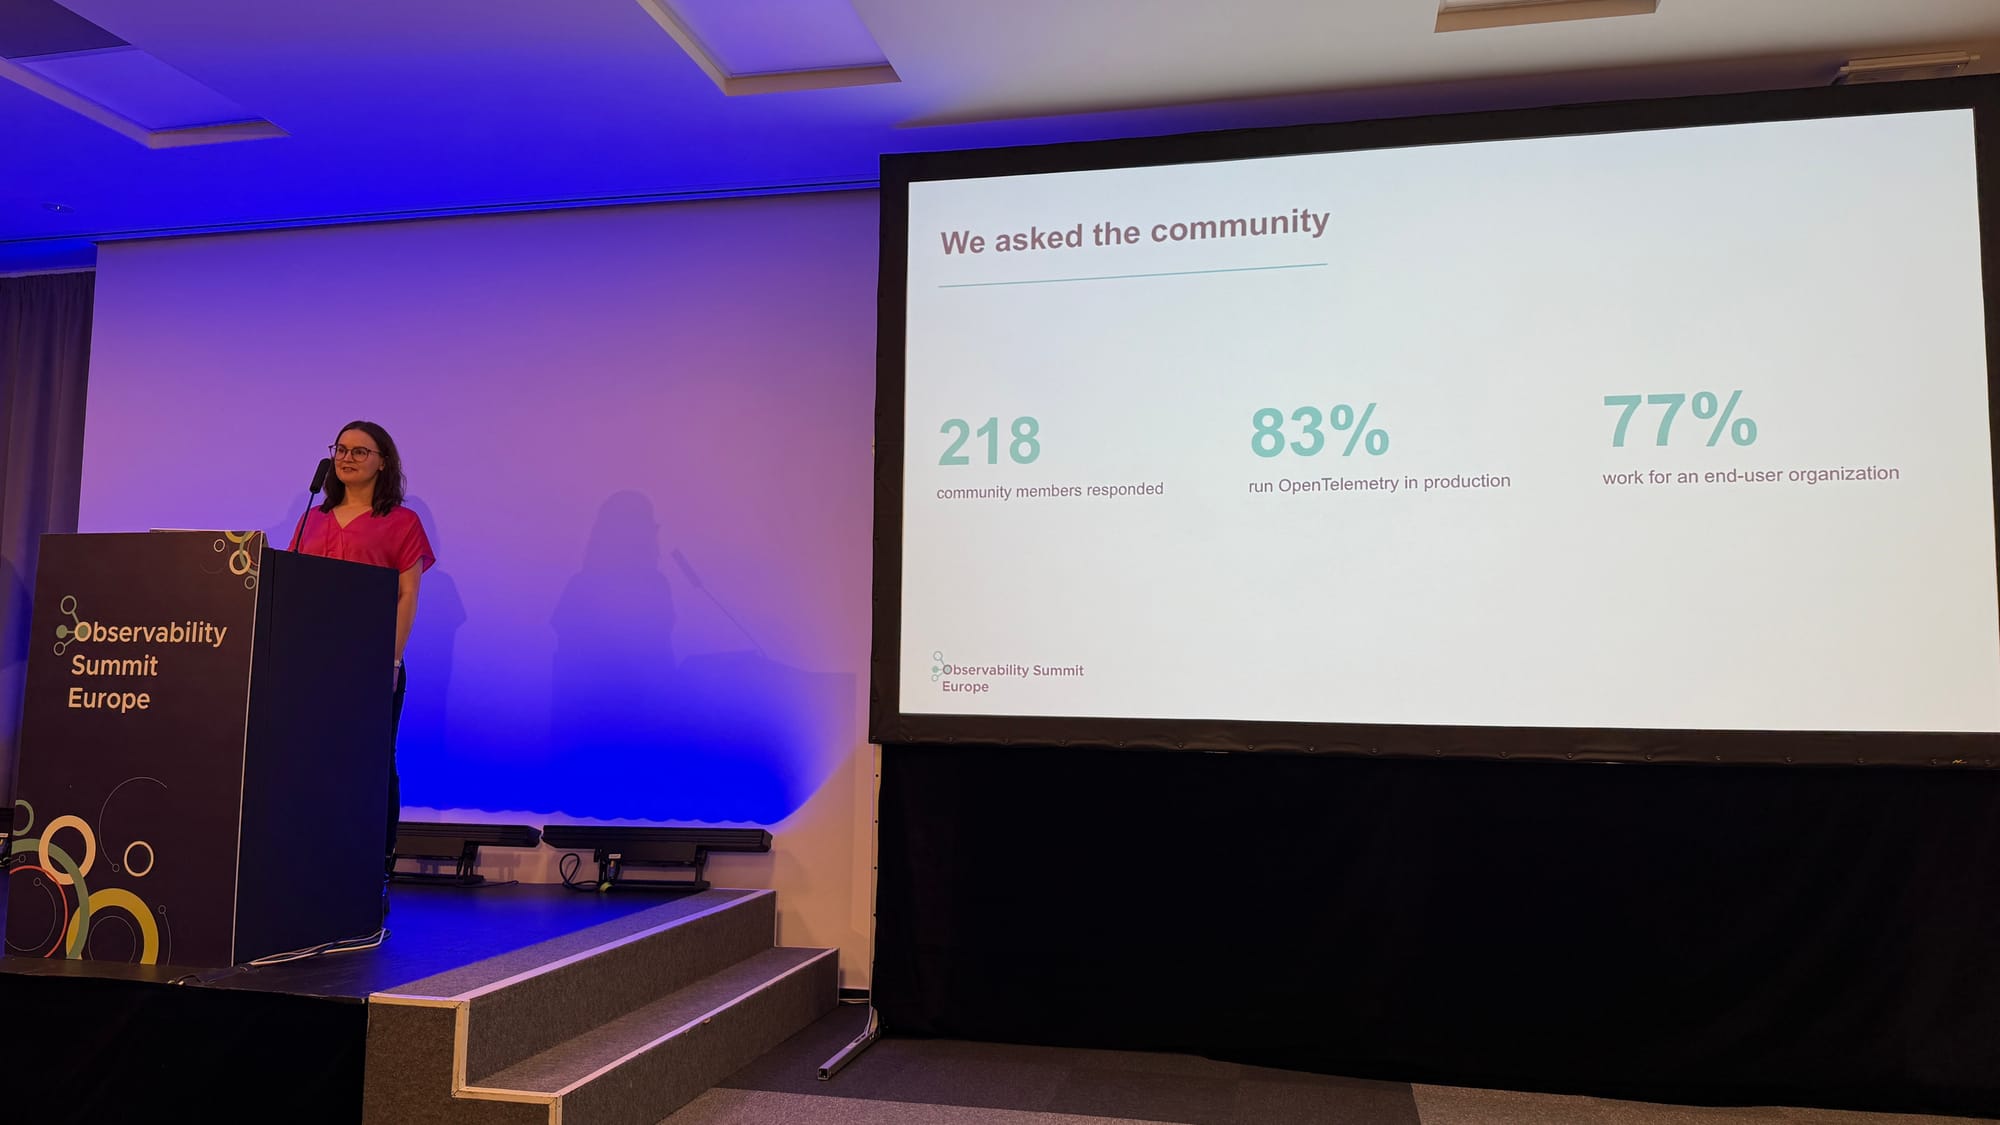
So they asked users instead. Together with the End User SIG, they ran a survey in early 2025. Of the 218 people who responded, 83% run OpenTelemetry in production and 77% work for an end-user organisation.
The strongest theme in the answers was that getting started is not the problem. There are plenty of hello world examples. What people wanted was clear guidance and practical examples for deploying and scaling the Collector.
The SIG’s answer was to interview companies of different sizes and publish their production setups, YAML and architecture diagrams included. Three stories are out so far.
Mastodon has one engineer running the Collectors, for about 300,000 daily active users. They run one Collector per namespace, which makes tail sampling easy, because every span of a trace already goes through the same Collector. They keep about 0.1% of successful traces and all of the error traces. In two years he hadn’t had a single problem with the Collector itself. Version bumps and deprecations were the pain.
Adobe has a central observability team and thousands of Collectors in a three-tier design. Service teams deploy a Helm chart that gives them a sidecar Collector and a deployment Collector in their own namespace. Those forward to a namespace the observability team manages, with one Collector per signal so a scaling problem with logs doesn’t affect traces. From there, telemetry goes to whichever backends the team picked in its Helm values.
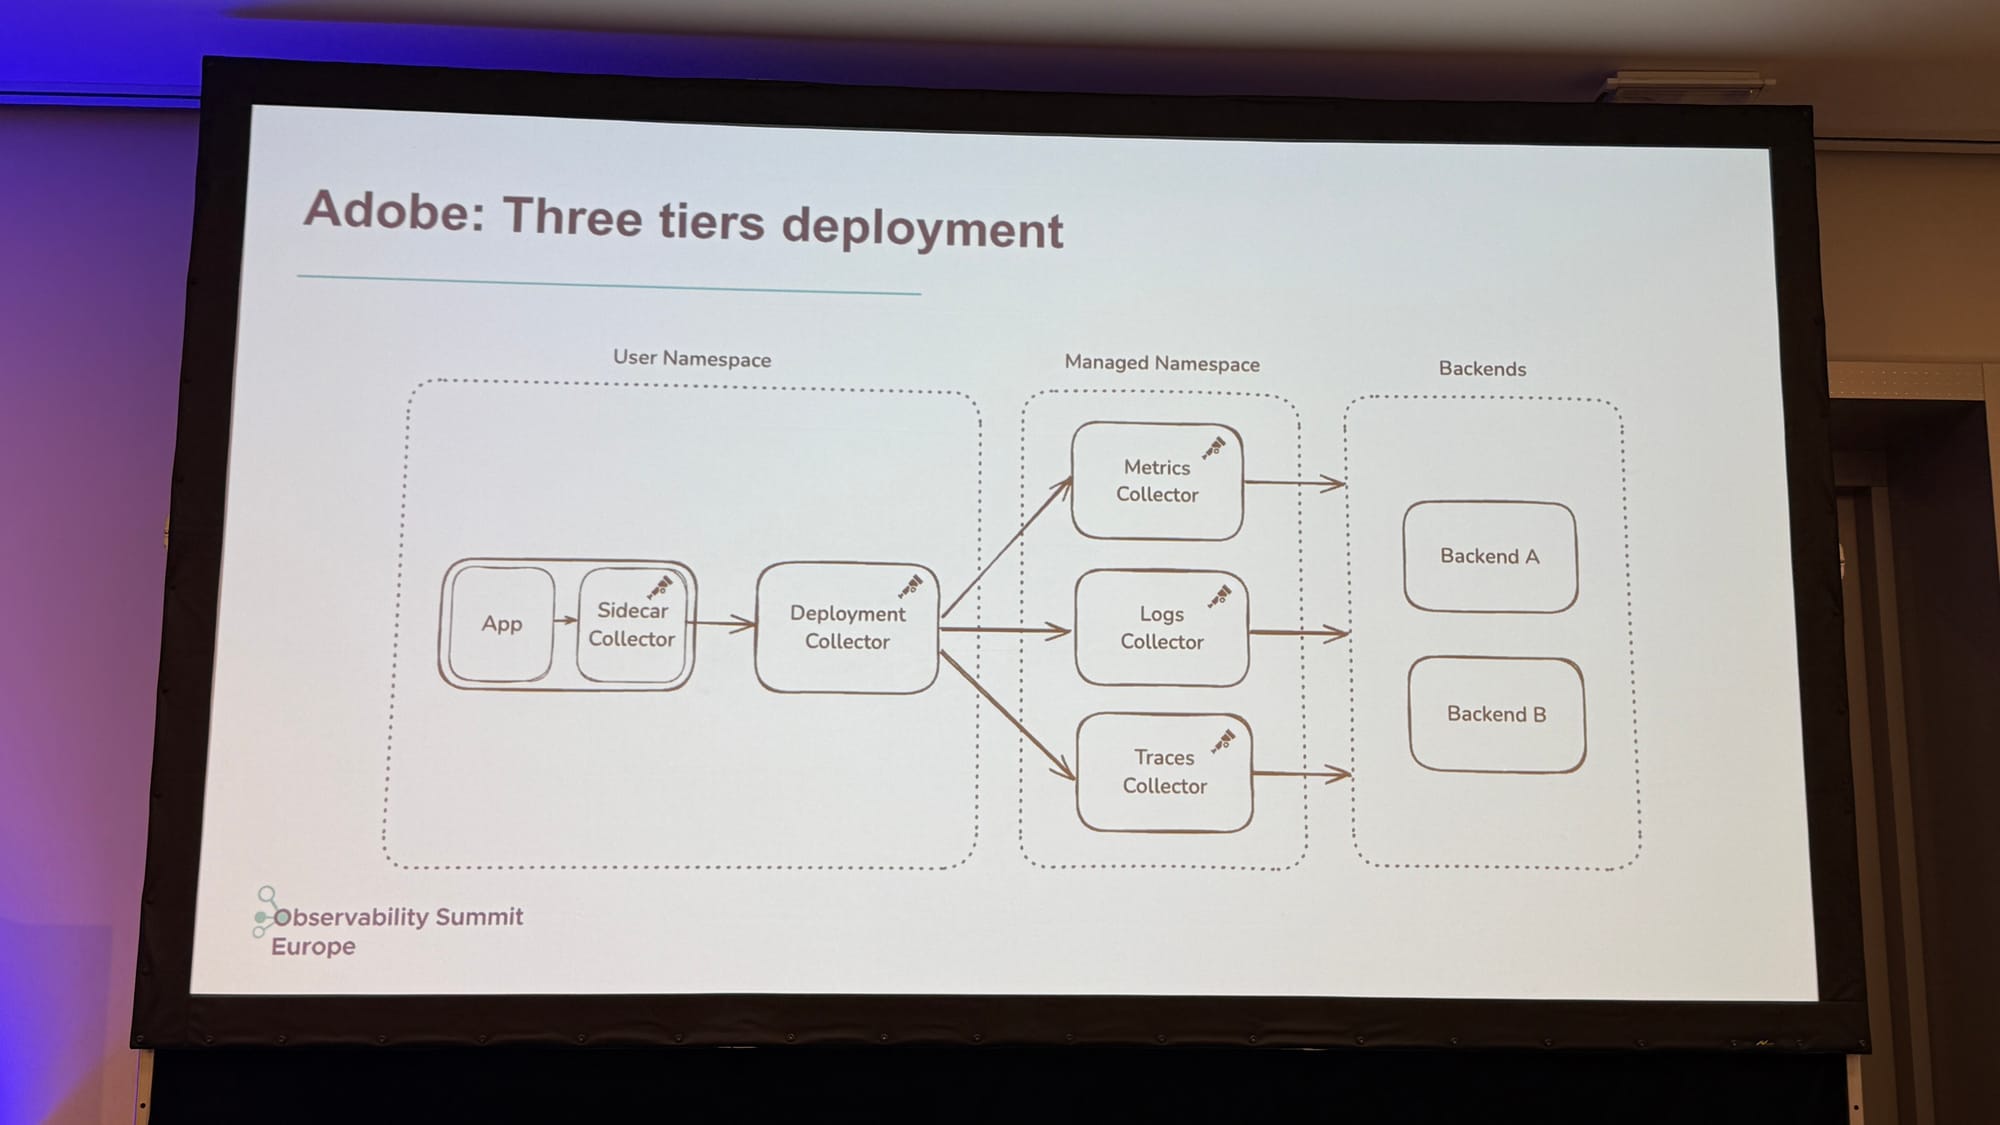
The goal is that service teams don’t have to become OpenTelemetry experts. The Operator’s auto-instrumentation does most of that work. As Bogdan Stancu from Adobe put it: “People add two lines in their deployment. And it just works.”
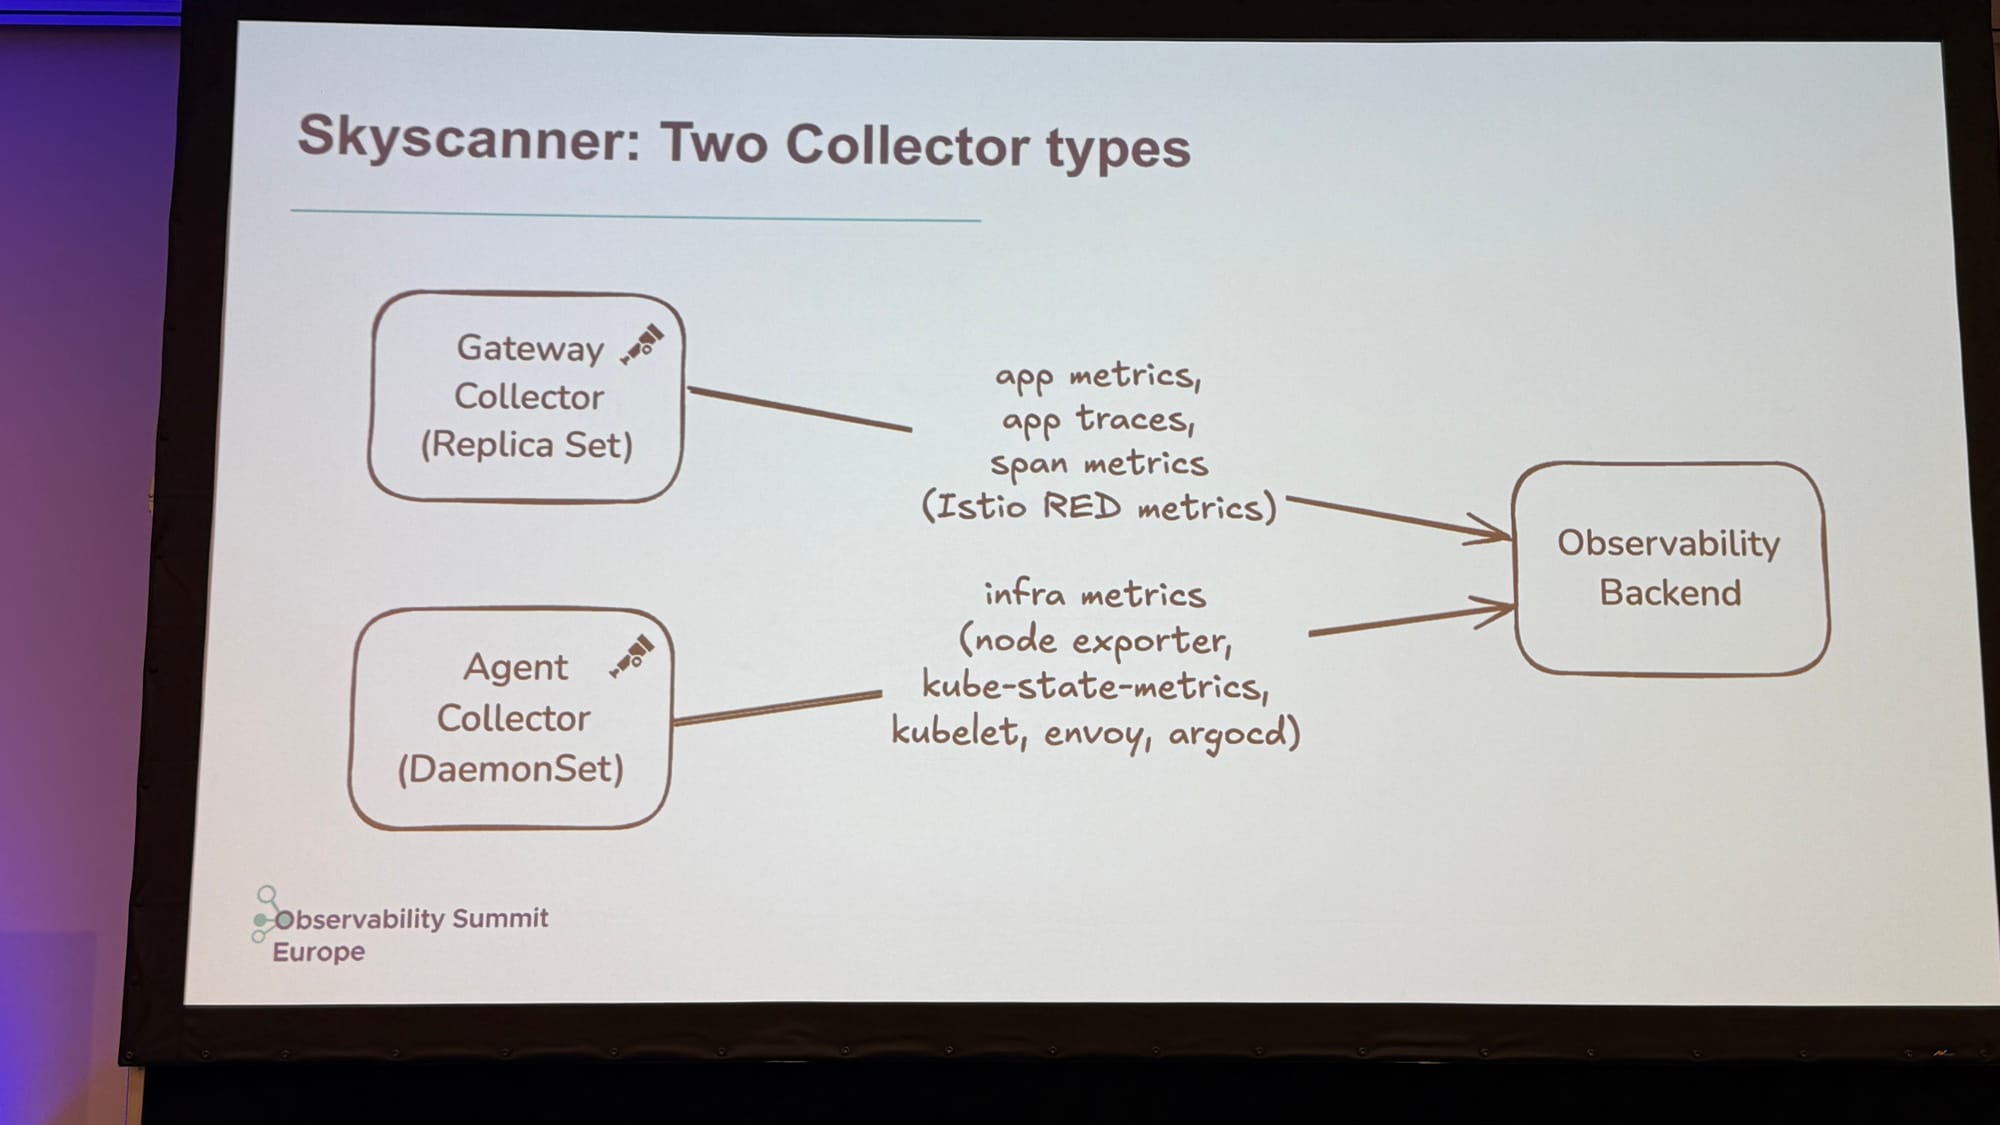
Skyscanner has a six-person platform team running Collectors for more than 1,000 microservices, mostly Java, across 24 production clusters. Every service sends to one DNS name, and Istio routes it to the closest Collector. Gateway Collectors handle OTLP, and agent Collectors running as a DaemonSet scrape Prometheus endpoints where OTLP isn’t an option yet. Their base Docker image ships the Java agent with auto-instrumentation switched off, except for gRPC and HTTP. “We disable everything, then enable what we need.”
Across the interviews, the first Collector was the hardest. Once teams knew the components and the deployment flow, the next ones got much easier. The organisations that do this well have three things in common.
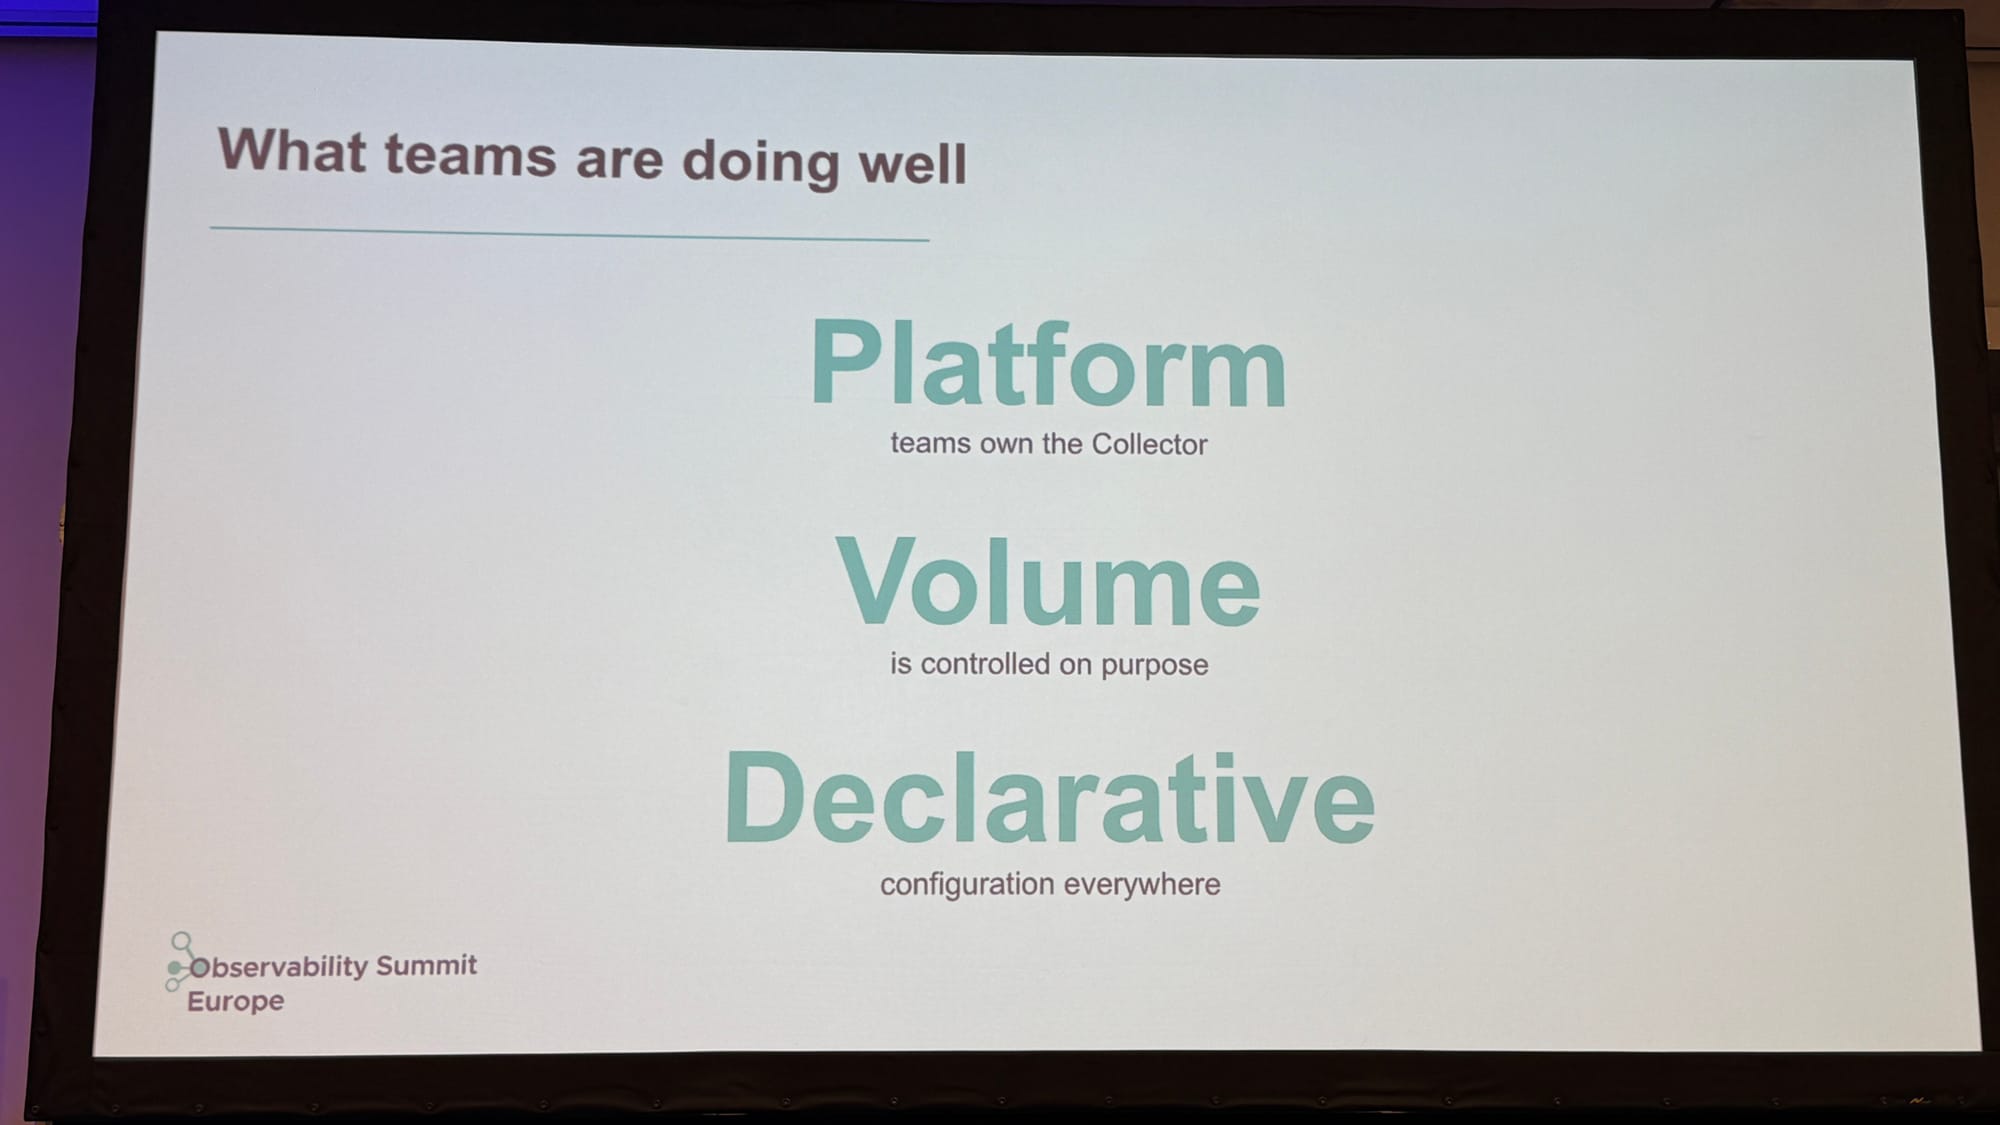
This is the platform engineering argument I keep making, backed by real production setups. The work now continues as OpenTelemetry Blueprints and Reference Implementations. Blueprints are design-pattern guidance for common problems, and Reference Implementations are stories like these. Three more stories are written and waiting for company approval, which, as they found out, takes much longer than the interview itself.
Three agents, one crown
Henrik Rexed’s “Telemetry Colosseum” pitted the OpenTelemetry Collector against Fluent Bit v5 and OTel-Arrow, the Rust-based engine built around the OpenTelemetry Arrow protocol (OTAP). He was clear that this was feedback for the maintainers, not blame, and that OTel-Arrow is experimental enough that some of his findings may be out of date within months.
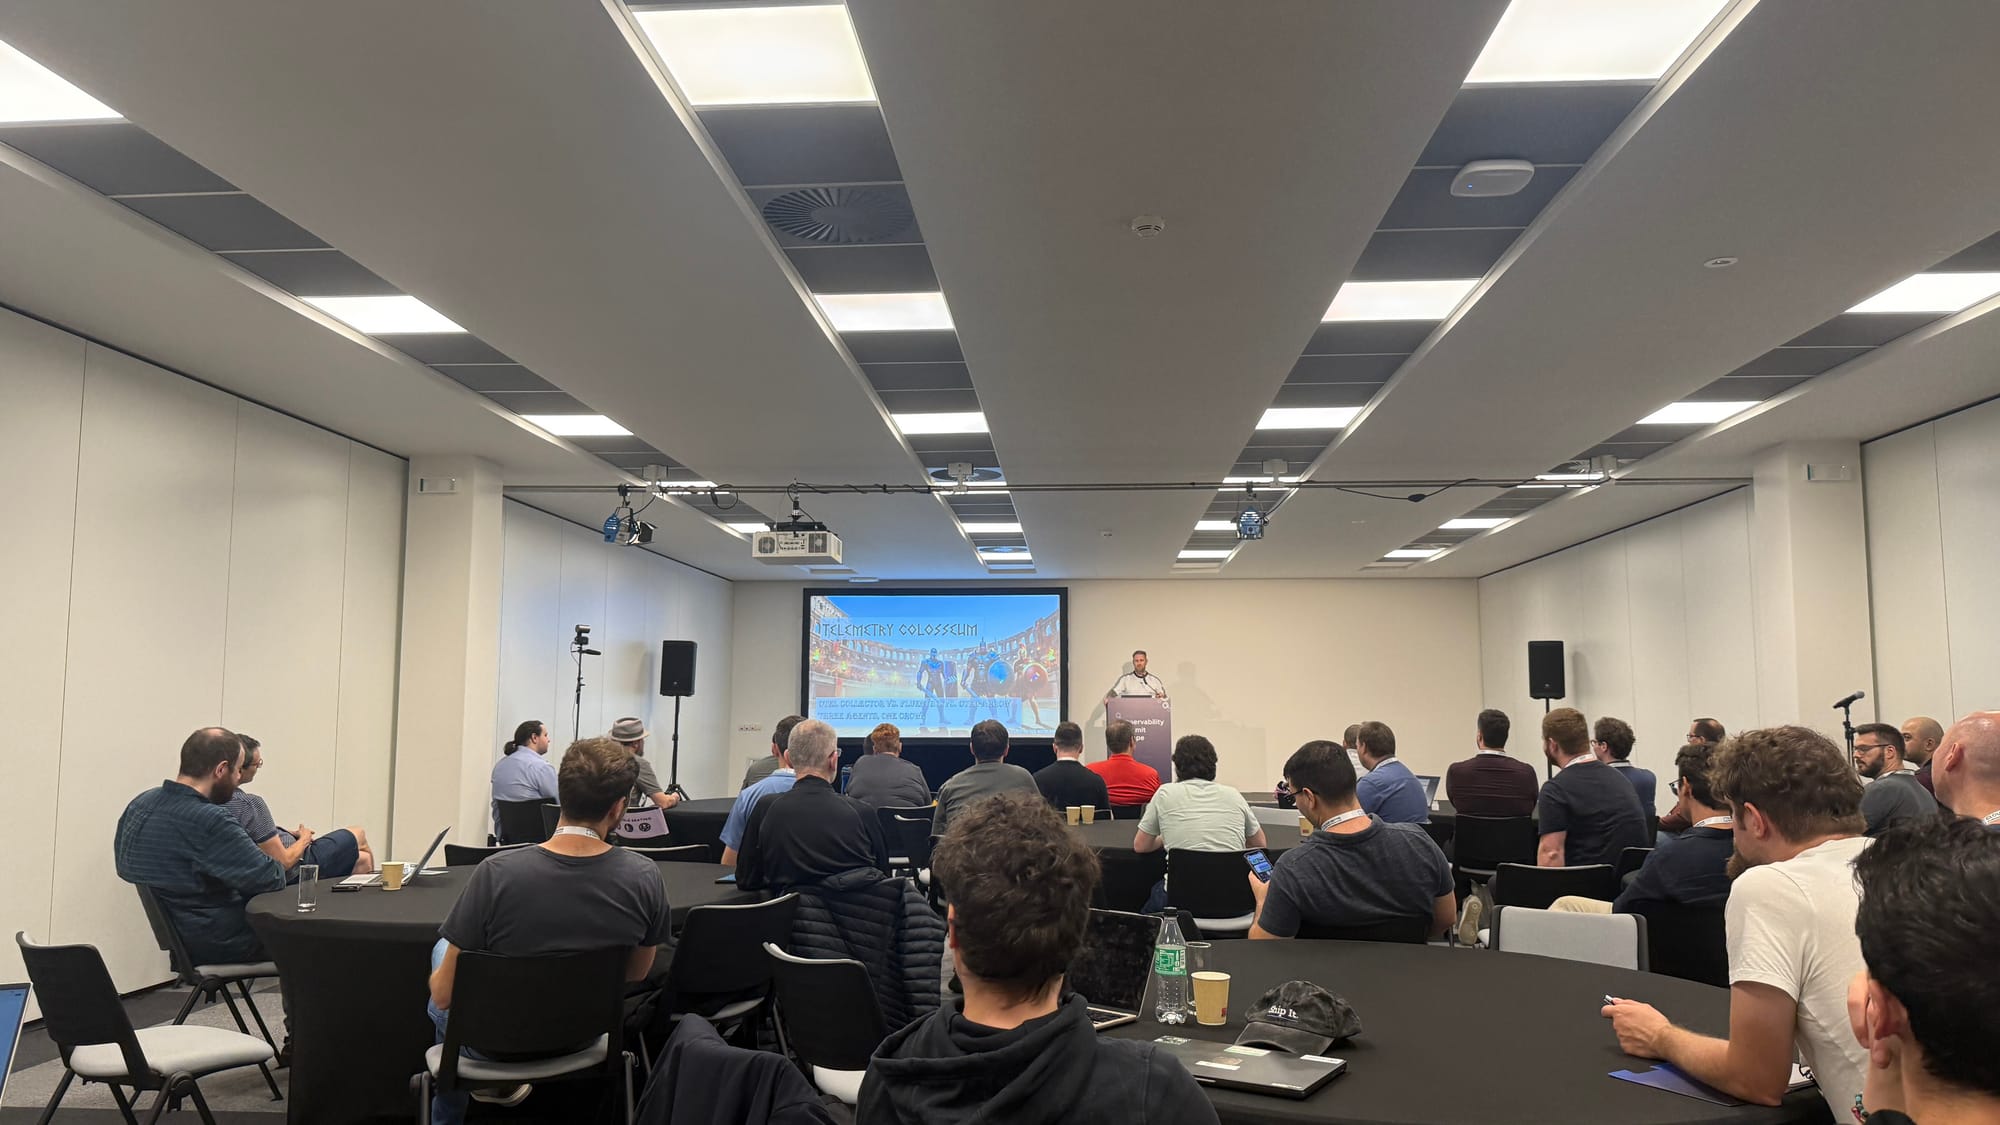
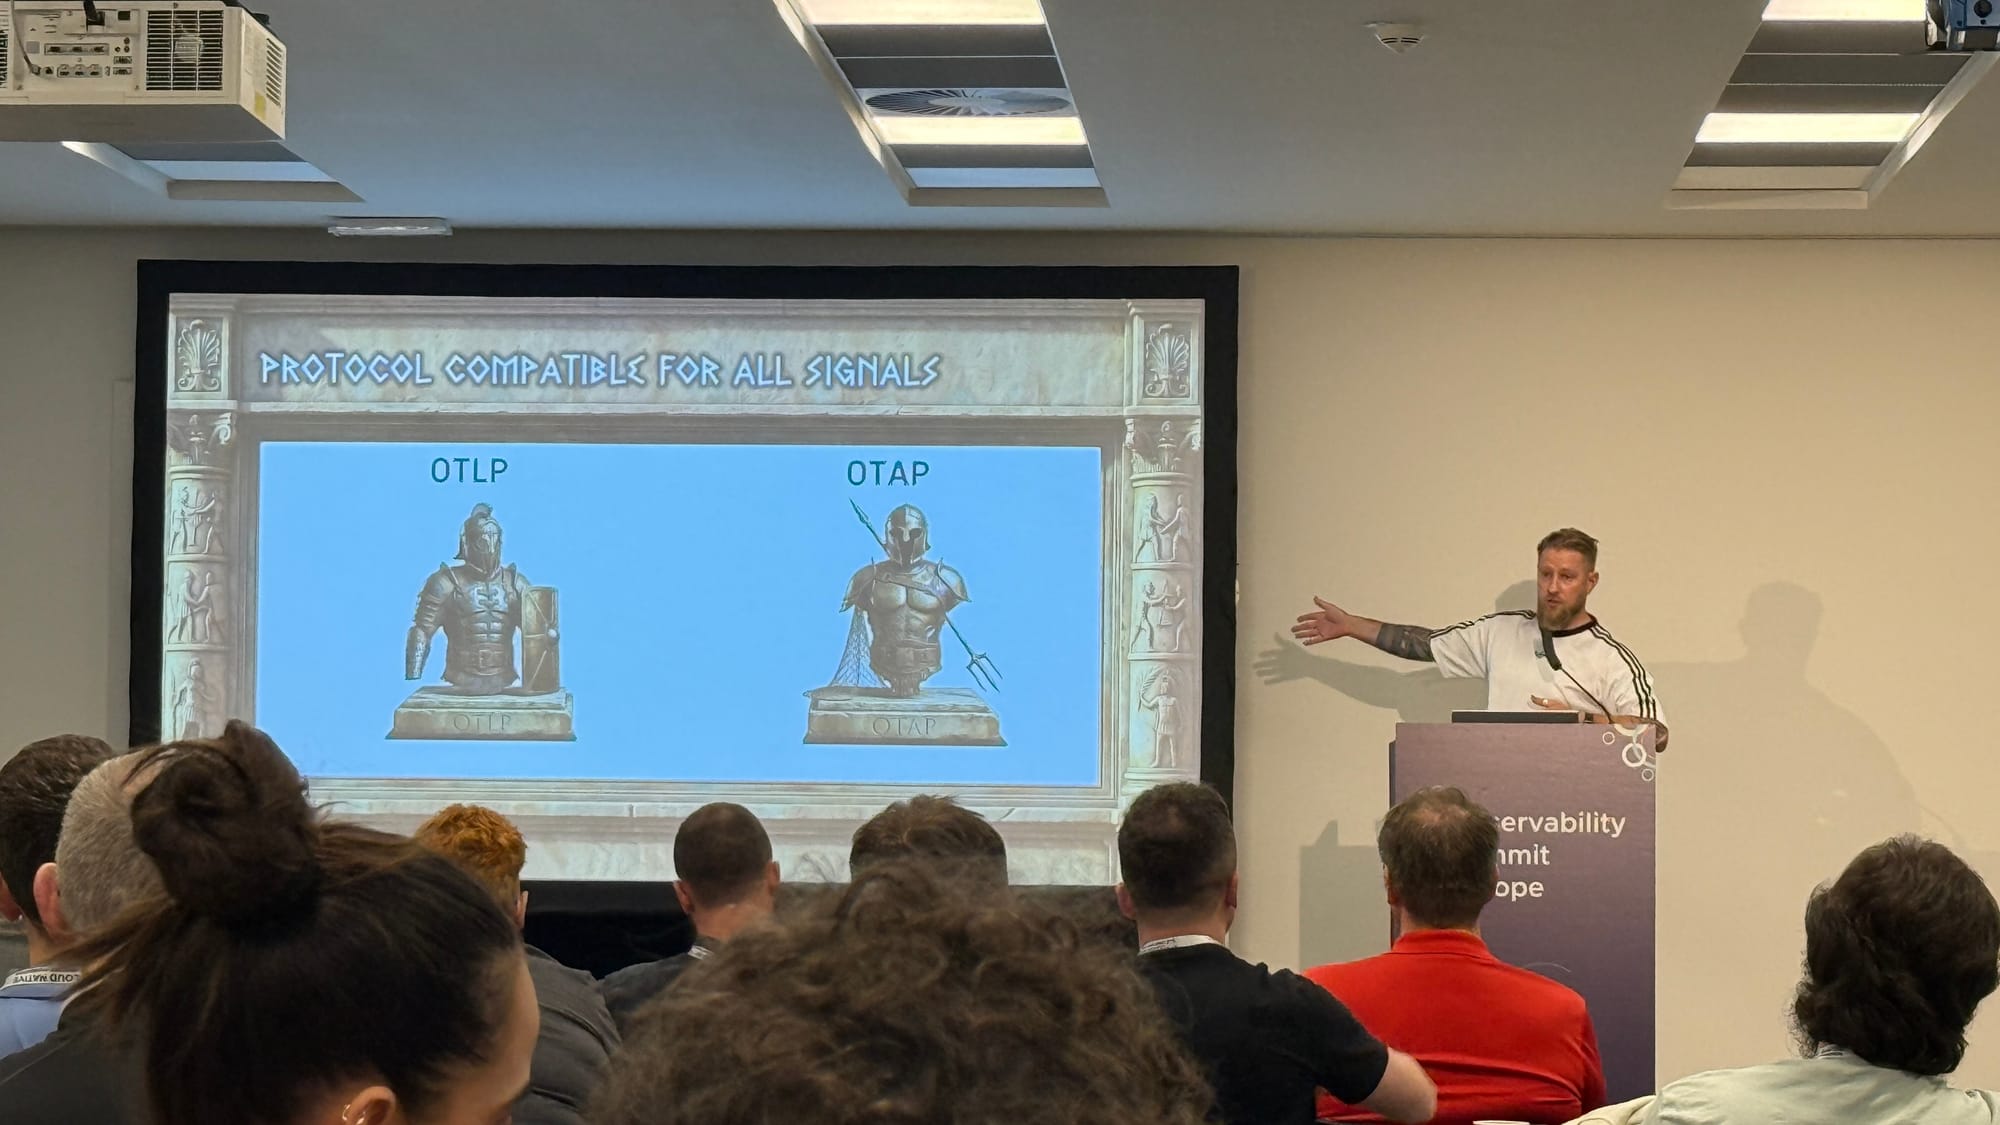
He started with the protocol, because it ended up being the conclusion. OTLP repeats the attributes on every record. The sender packs the data into protobuf, the next hop unpacks it, and packs it again for the hop after that. All of that costs CPU. OTAP is columnar and dictionary-encoded, so repeated values cross the network once and the data arrives in a shape that’s easy to work with.
On pipeline design he called it a draw. Fluent Bit’s flat YAML with tags, the Collector’s list of components wired together in a service section, and OTel-Arrow’s nodes and connectors can all express the same pipelines. Which one you prefer is mostly habit. Plugin coverage was a different story. OTel-Arrow can’t read logs from files yet, can’t add Kubernetes metadata, can’t scrape Prometheus or receive remote write, and has no sampling. Its transform language, OPL, will feel familiar to anyone who knows OTTL. Fluent Bit v5 added delta conversion for metrics and has had tail sampling since v4.
The benchmark ran the OpenTelemetry Demo with Istio, adding 50 users every 30 minutes up to 200 over two hours. Fed OTAP, OTel-Arrow was in a different league: around 10 millicores of CPU and almost no memory, against 100 to 120 millicores when the same engine received OTLP. Over OTLP it had no edge. It used more CPU and memory than the Collector, whose memory stayed flat, while Fluent Bit’s memory climbed sharply. So the gain depends on OTAP end to end, and that’s the catch today. SDKs don’t emit OTAP yet, so a Collector has to translate in front of OTel-Arrow, and in his runs that Collector used more CPU and memory than anything else. The savings moved rather than disappeared. He has opened an issue and plans to retest.
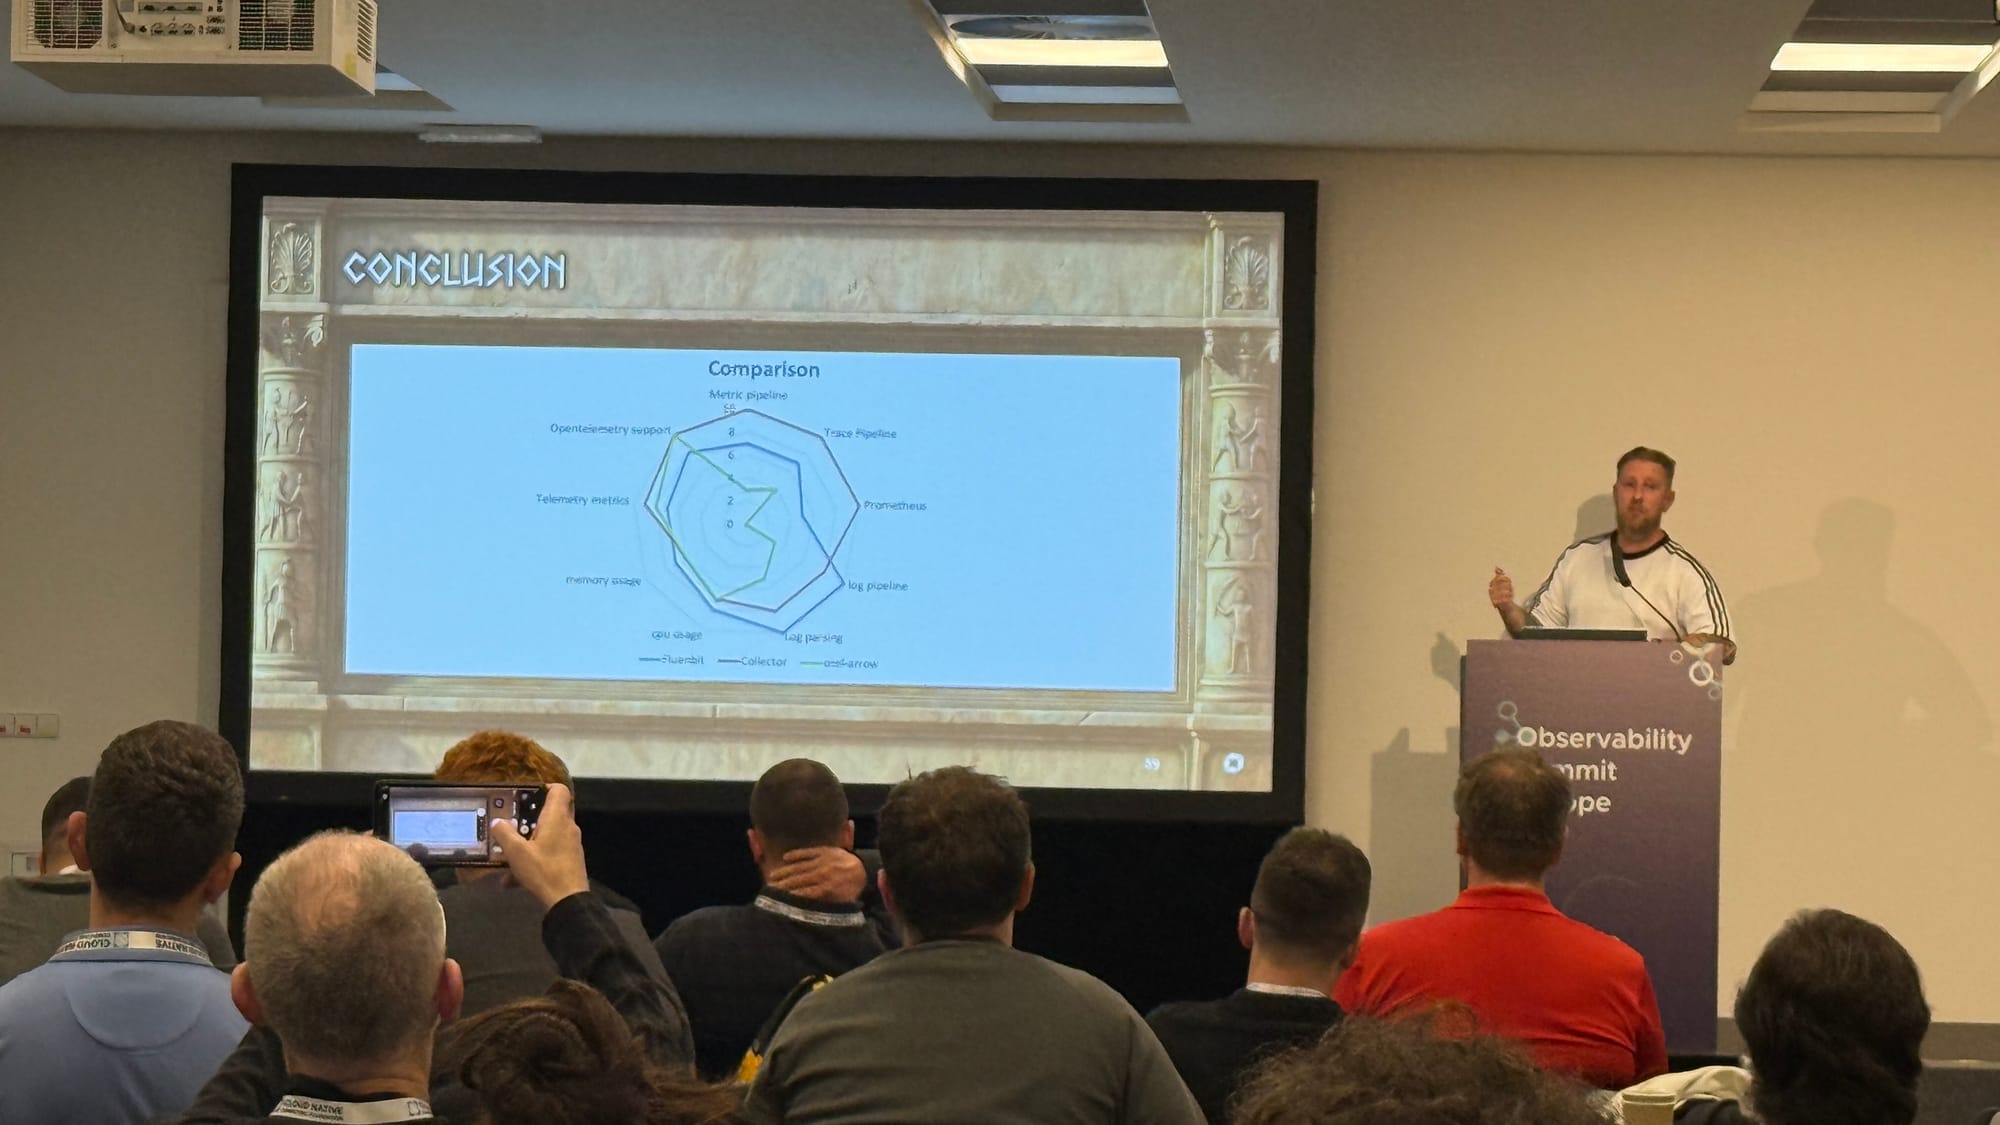
The network numbers are where OTAP pays off. For the same traces, metrics and logs, it sent a fraction of the TCP packets. On a cloud bill, that’s real money. His ranking as of 5 October: the Collector first, Fluent Bit second, OTel-Arrow third. OTAP is the part to watch, and it gets interesting once SDKs and vendor endpoints speak it natively.
Stable by default
The talk I was most curious about was “From Schema to Shipping Data: Making OpenTelemetry Stable by Default” by Christos Markou from Elastic and Pablo Baeyens from Datadog. It makes a point that’s easy to miss. You can’t make OpenTelemetry stable by stabilising the Collector alone, because the Collector emits a schema, and the schema is defined somewhere else, in the semantic conventions. Both have to stabilise together.
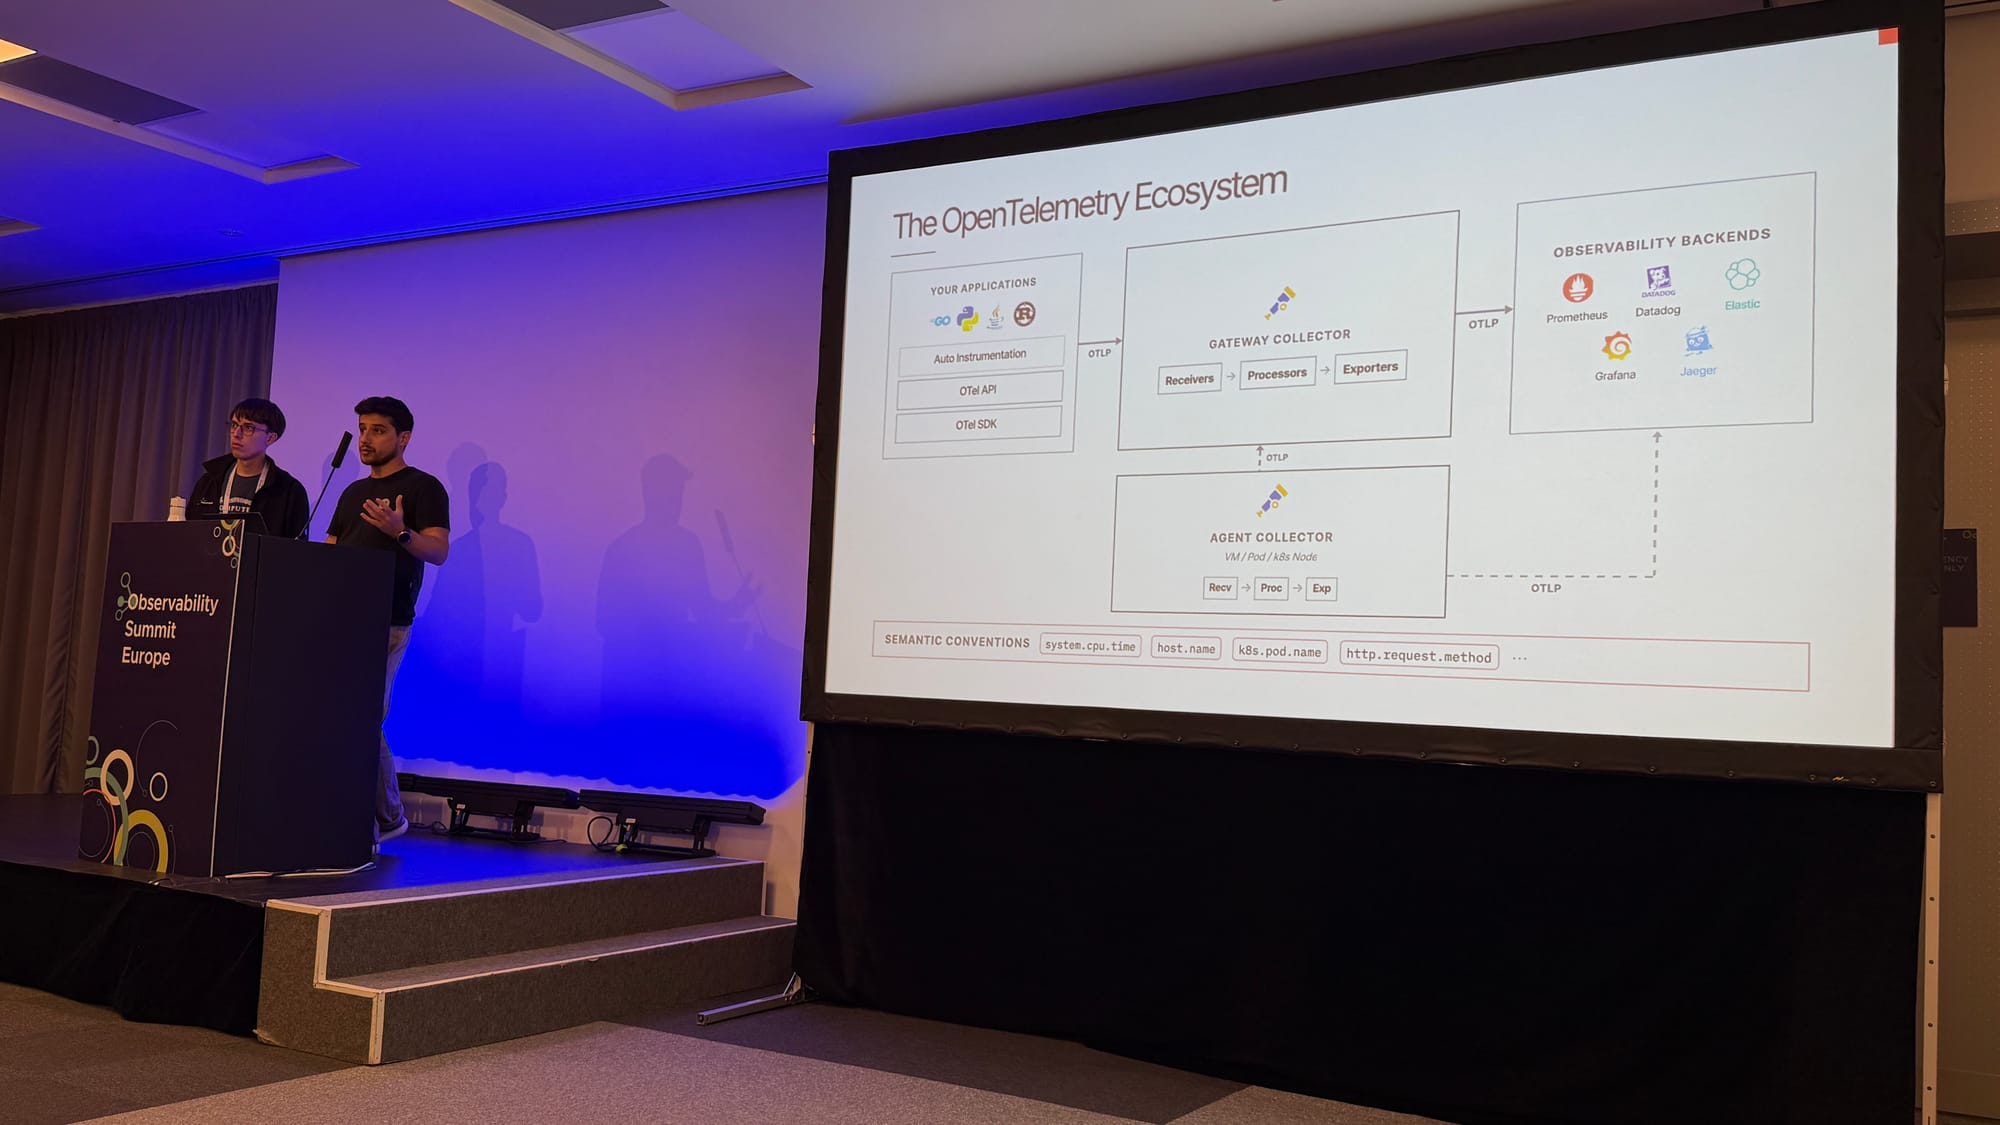
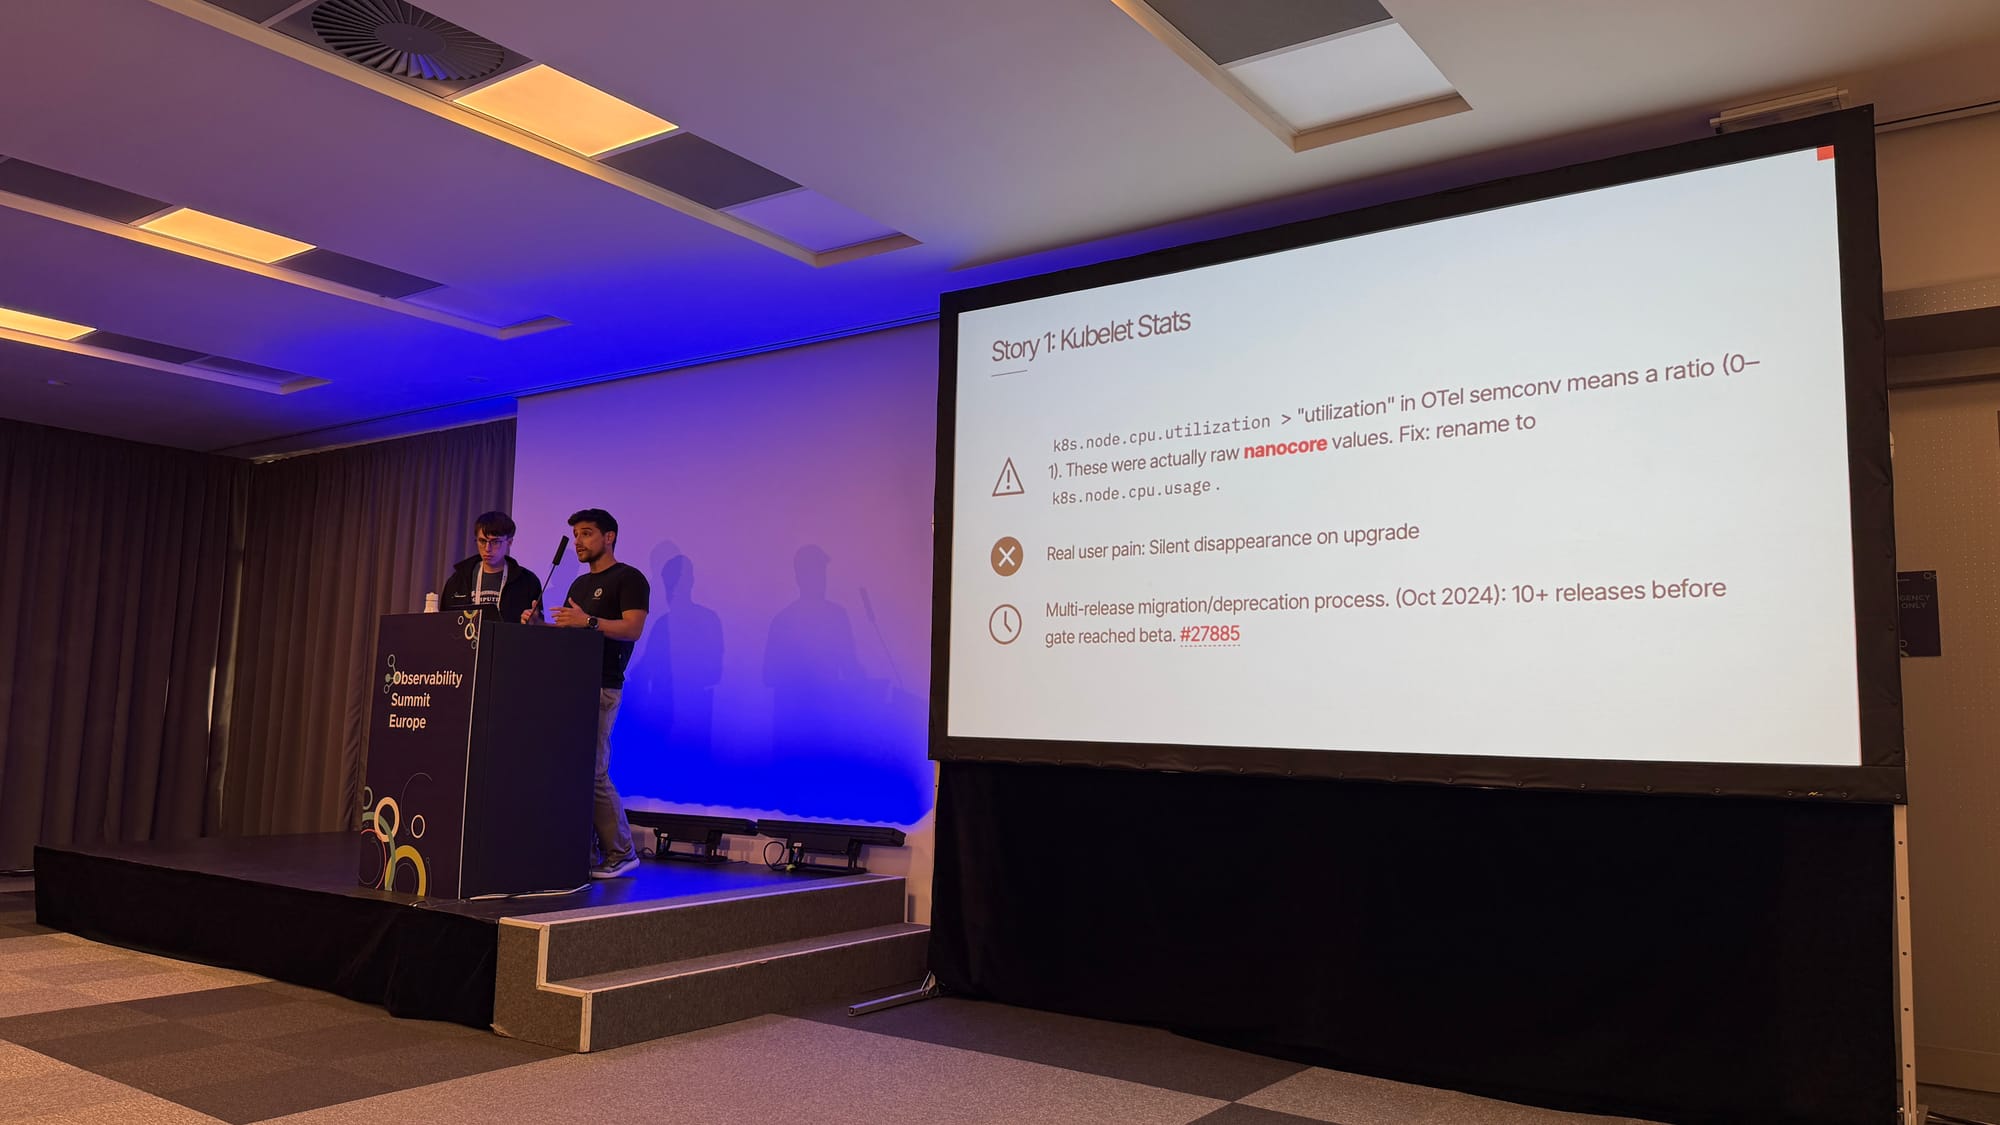
Two stories showed why. The kubeletstats receiver shipped a metric called k8s.node.cpu.utilization, but in the semantic conventions “utilization” means a ratio between 0 and 1, and these were raw nanocore values. The fix was a rename to k8s.node.cpu.usage. Done carelessly, a rename means your dashboard goes blank and your alert stops firing after an upgrade. Done carefully, it sat behind a feature gate for more than 10 releases before it became the default. The HTTP semantic conventions were the same problem at a much larger scale. Renaming http.method to http.request.method and friends affected every Collector component, every language SDK and plenty of user pipelines.
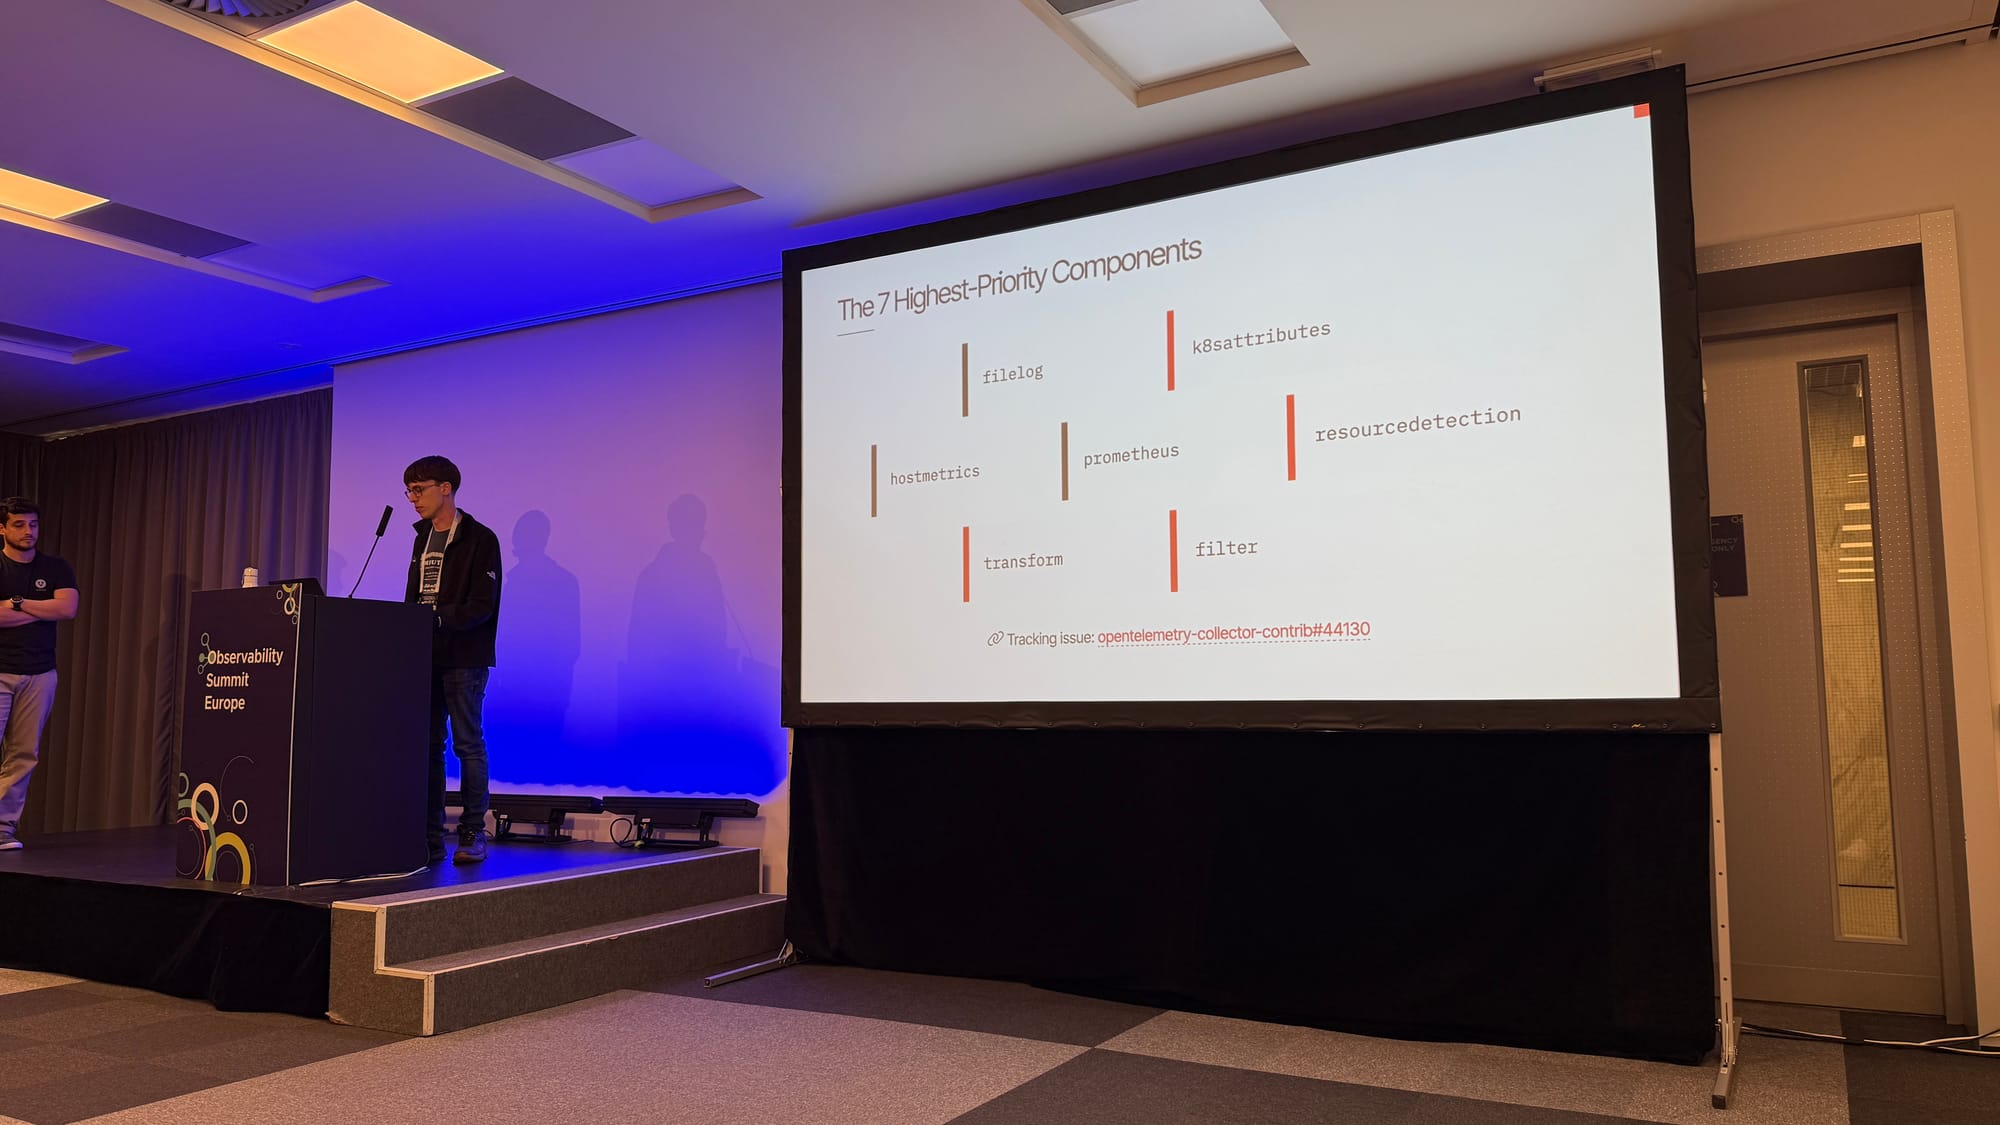
A bit over half of the respondents to the last Collector survey named stability as their top concern, and the same confusion came up in the CNCF’s graduation interviews with adopters. For the semantic conventions, stable simply means names and values don’t change. For a Collector component, it’s broader: configuration, tests, documentation, internal telemetry, and a community of maintainers and real adopters behind it. The Collector SIG picked seven components to stabilise first, and uses them as a template for the rest.
For schema changes, there’s now a standard migration with two feature gates per component. First you can opt in to the new names, or publish both. Then the new names become the default and you can opt out. Because it’s per component, different teams owning different parts of a pipeline can migrate at their own pace.
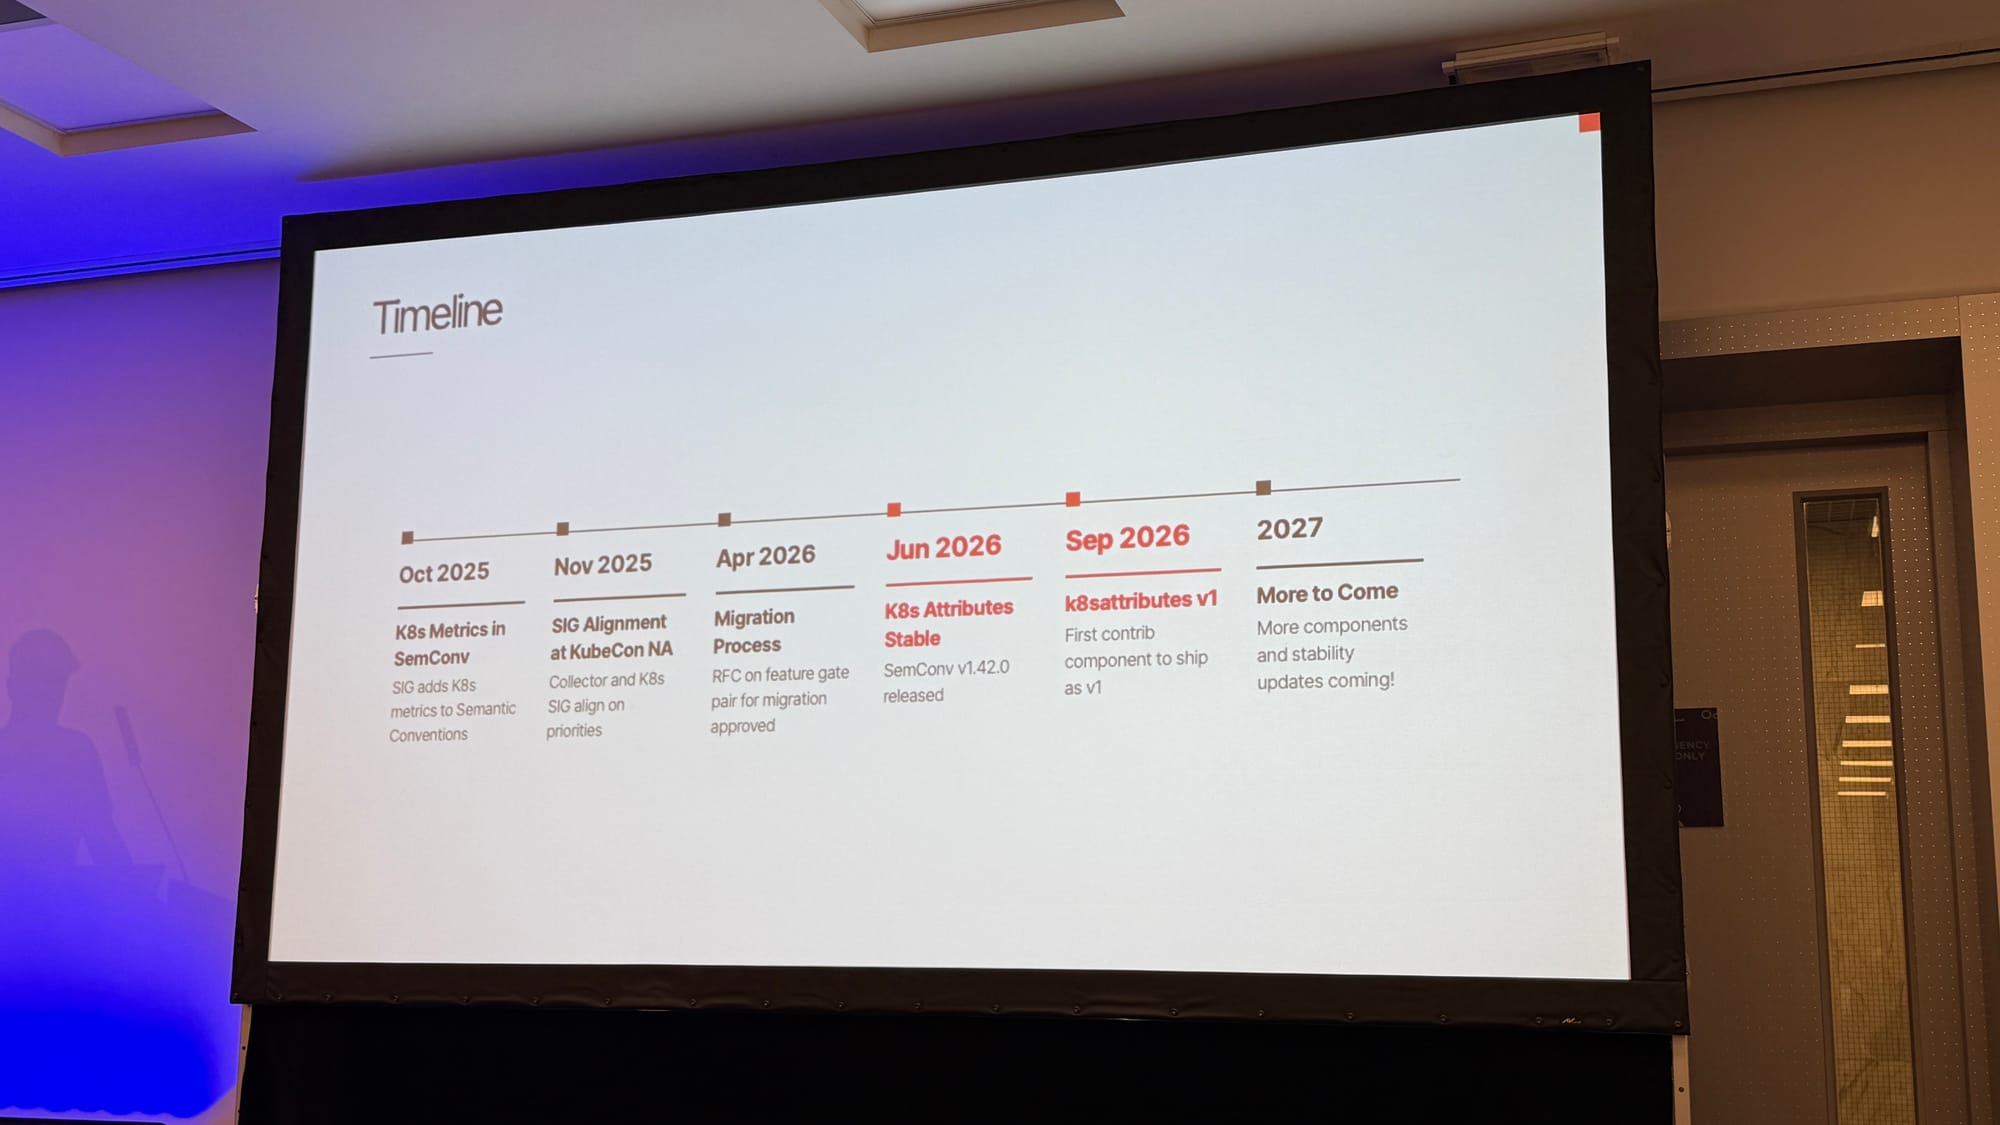
The Kubernetes semantic conventions SIG had ported every Kubernetes metric the Collector emits into the semantic conventions by October 2025. At KubeCon North America in November, the SIG decided to align with the Collector’s list and stabilise the attributes those seven components actually use. The Kubernetes attributes went stable in semantic conventions v1.42.0 in June. In September, the k8sattributes processor became the first stable component in Collector contrib. Process metrics are a release candidate and already available as an opt-in in the hostmetrics receiver, and 34 Kubernetes and container metrics are release candidates waiting to be ported.
Next up are Prometheus interoperability, where one major question about mapping the data models remains, and OTTL, which is close to stable. Pablo has also opened an RFC for a v1 core distribution with a stability-level flag that defaults to stable components only. To use beta or alpha components, you’d lower the level on purpose.
That is the part I find most interesting. Stable by default turns stability from something each user has to research component by component into something they get unless they ask for less.
Your agent did what?
Adriana and I closed the day with Your Agent Did What? Forensic Observability for Systems That Don’t Leave Obvious Footprints, the second outing for the talk we debuted at SREday London less than two weeks ago. The slides are on the talk page.
Our starting point a few months ago was that GenAI observability was fragmented. OpenInference, OpenLLMetry and framework-specific conventions solve the same problems with different attribute names. The model is llm.model_name in one and gen_ai.request.model in another. The good news is that most of them are converging on OpenTelemetry’s GenAI semantic conventions. For the rest, there’s the GenAI normalizer processor in Collector contrib, which maps OpenInference and OpenLLMetry attributes to gen_ai.* at the Collector.
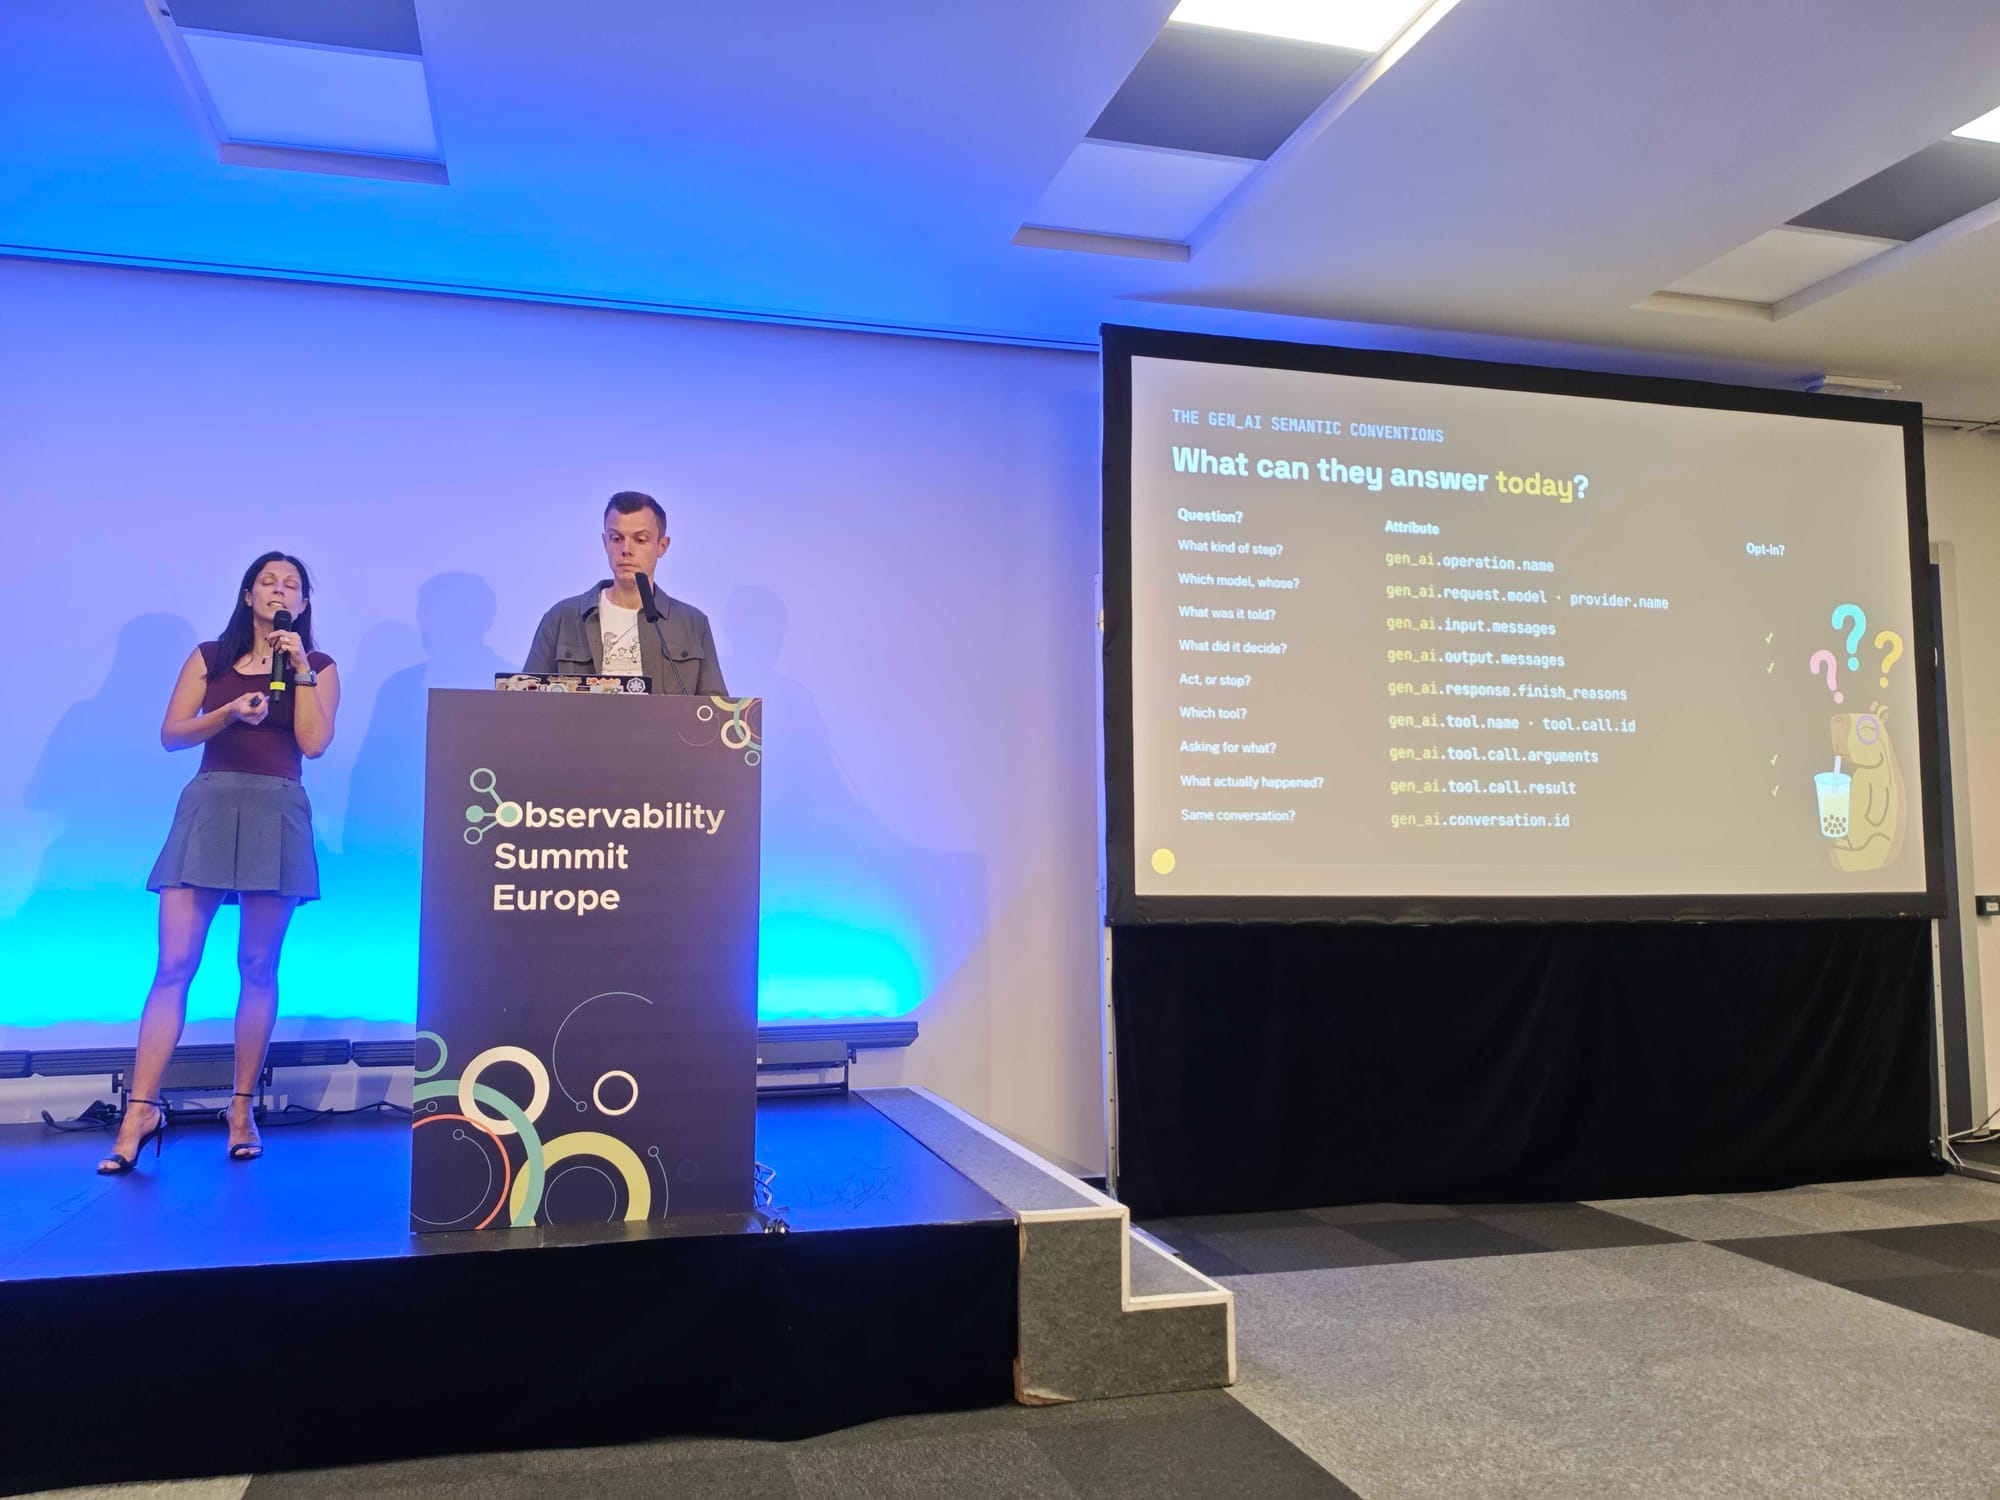
Then the demo. A rogue goose agent deletes rows from a database, and three AI SRE agents investigate: Capybara in Java with LangChain4j, Beaver in Python with OpenInference, and Otter in Python with OpenLLMetry. All three send telemetry through one Collector with the normalizer processor, so we can compare what each one captured.
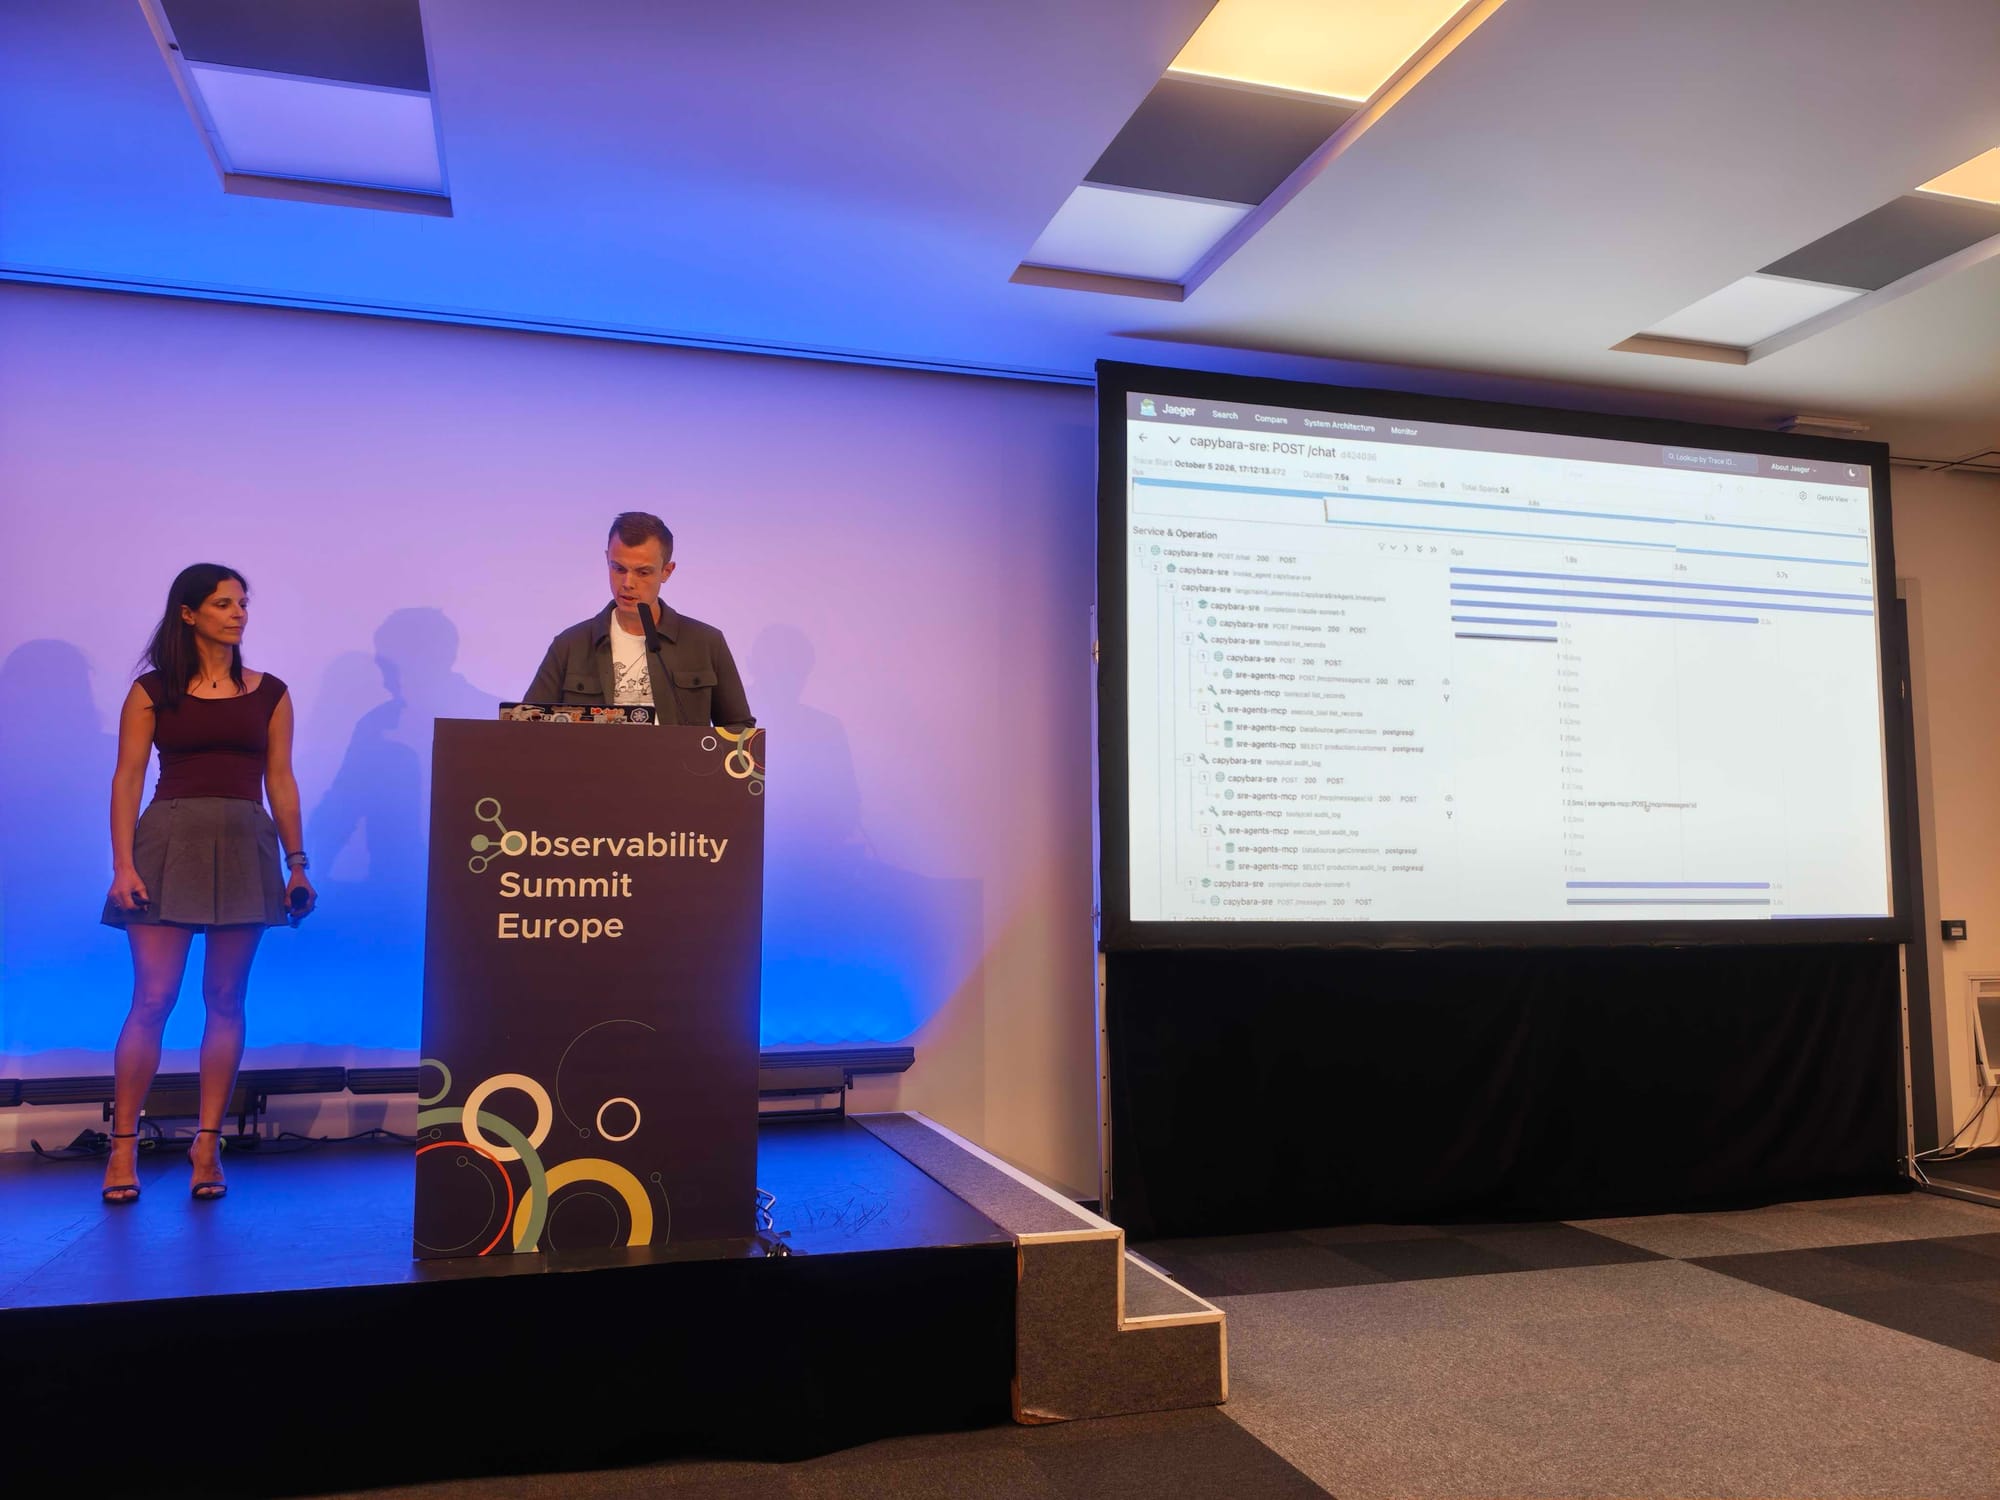
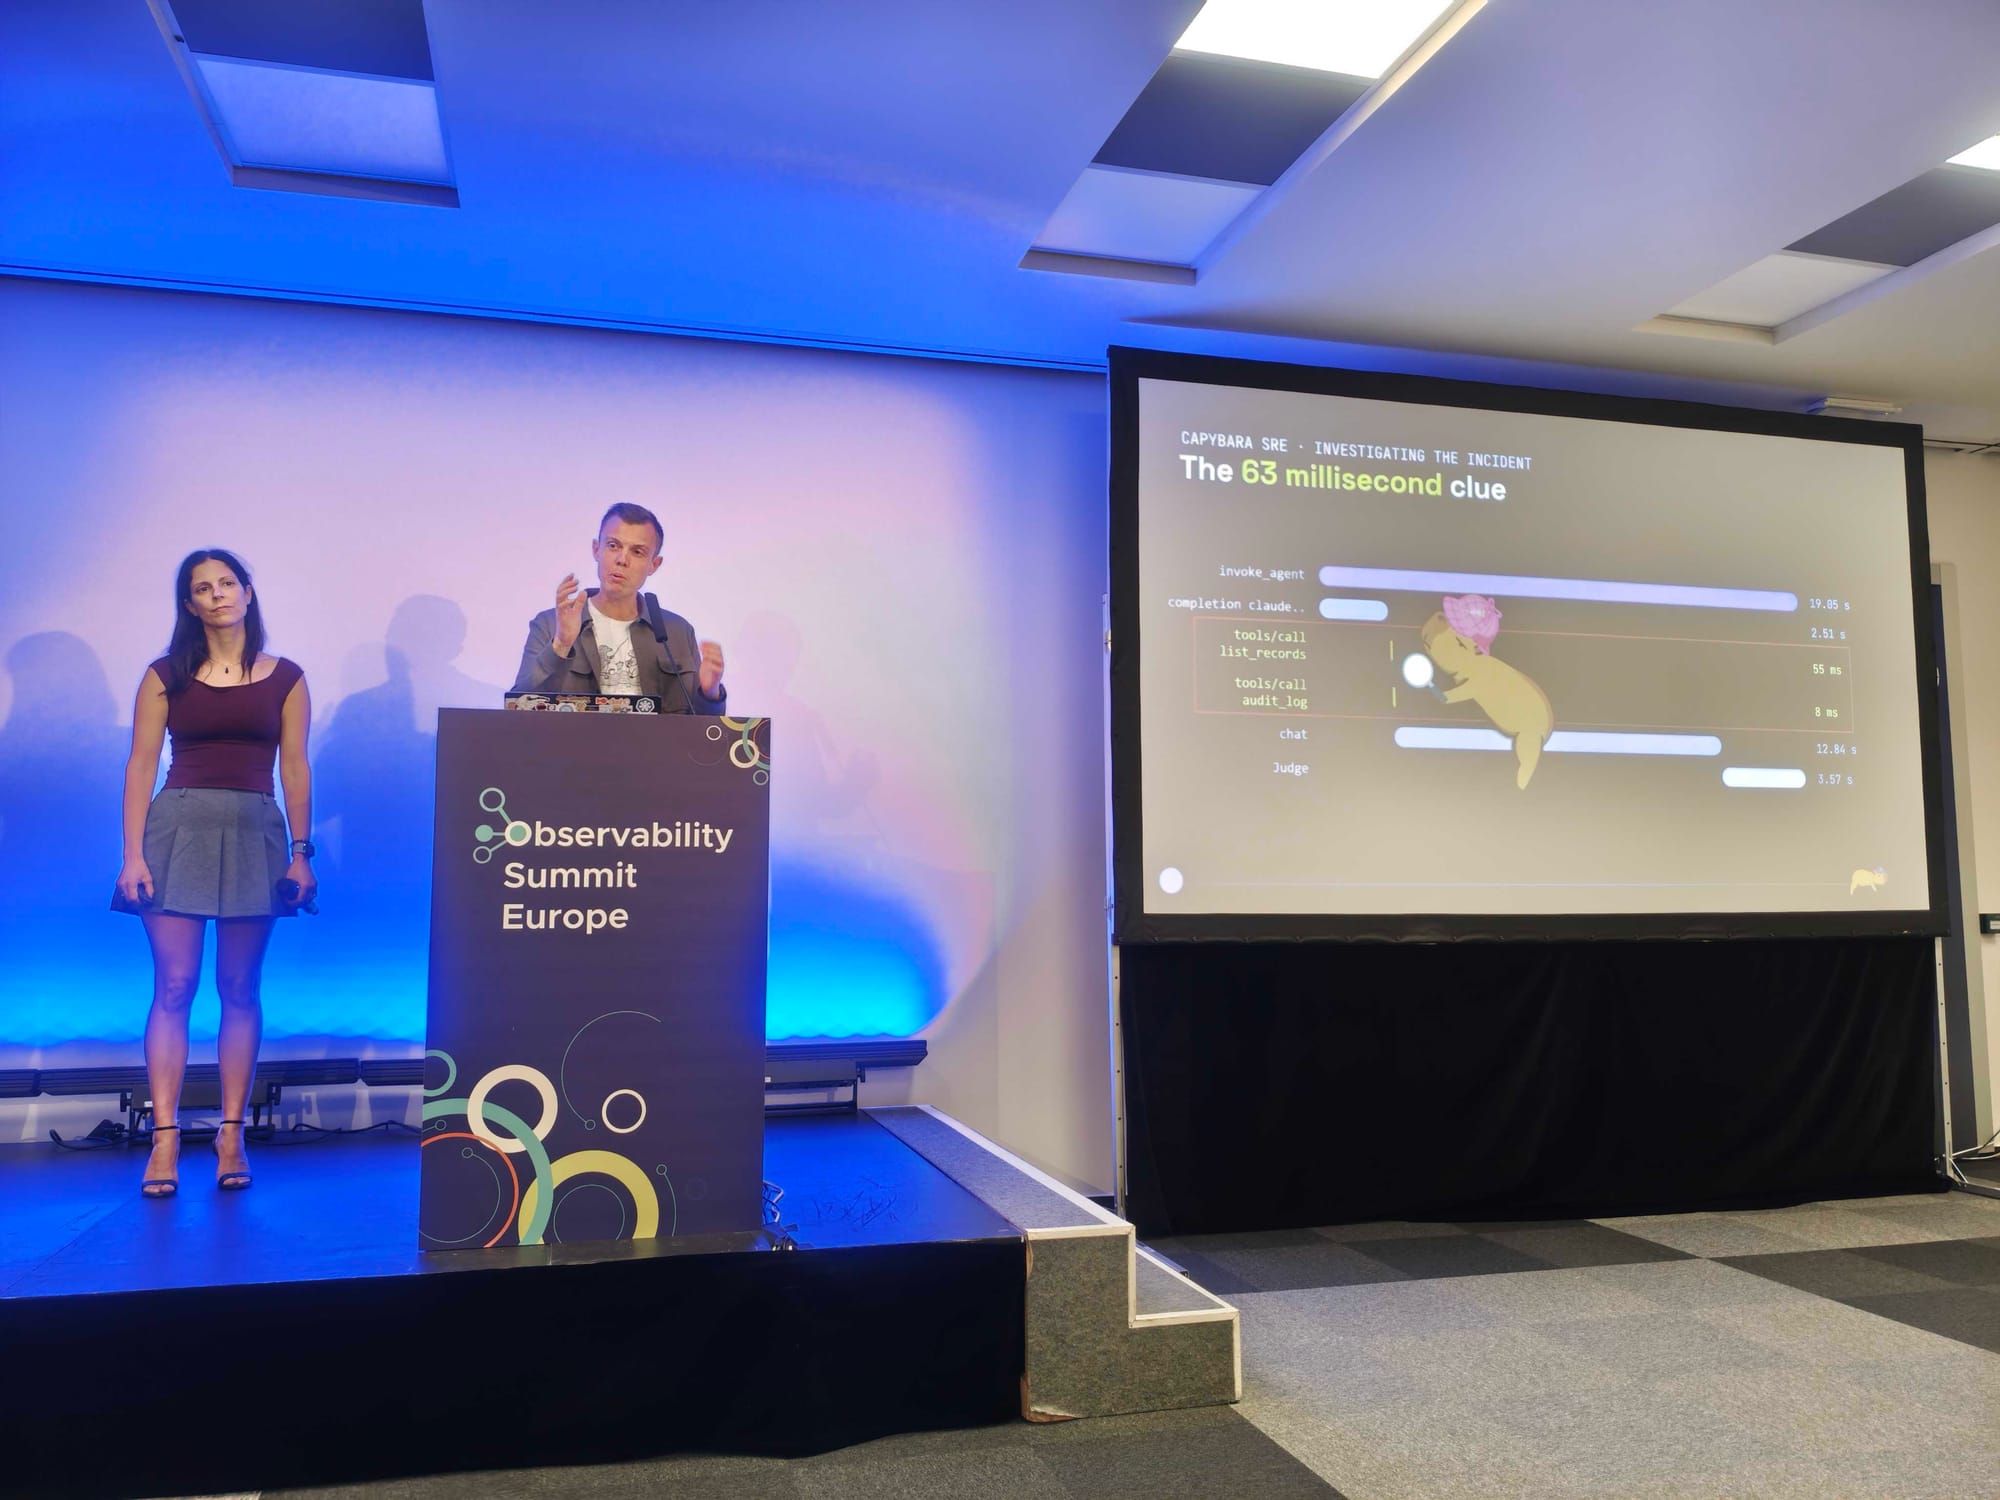
The investigation takes about 19 seconds, mostly model calls. The two tool calls that crack the case, list_records and audit_log, take 63 milliseconds between them. The answer is in the audit_log result. The DELETEs came from the client goose, using the deploy_svc database role. Goose did it.
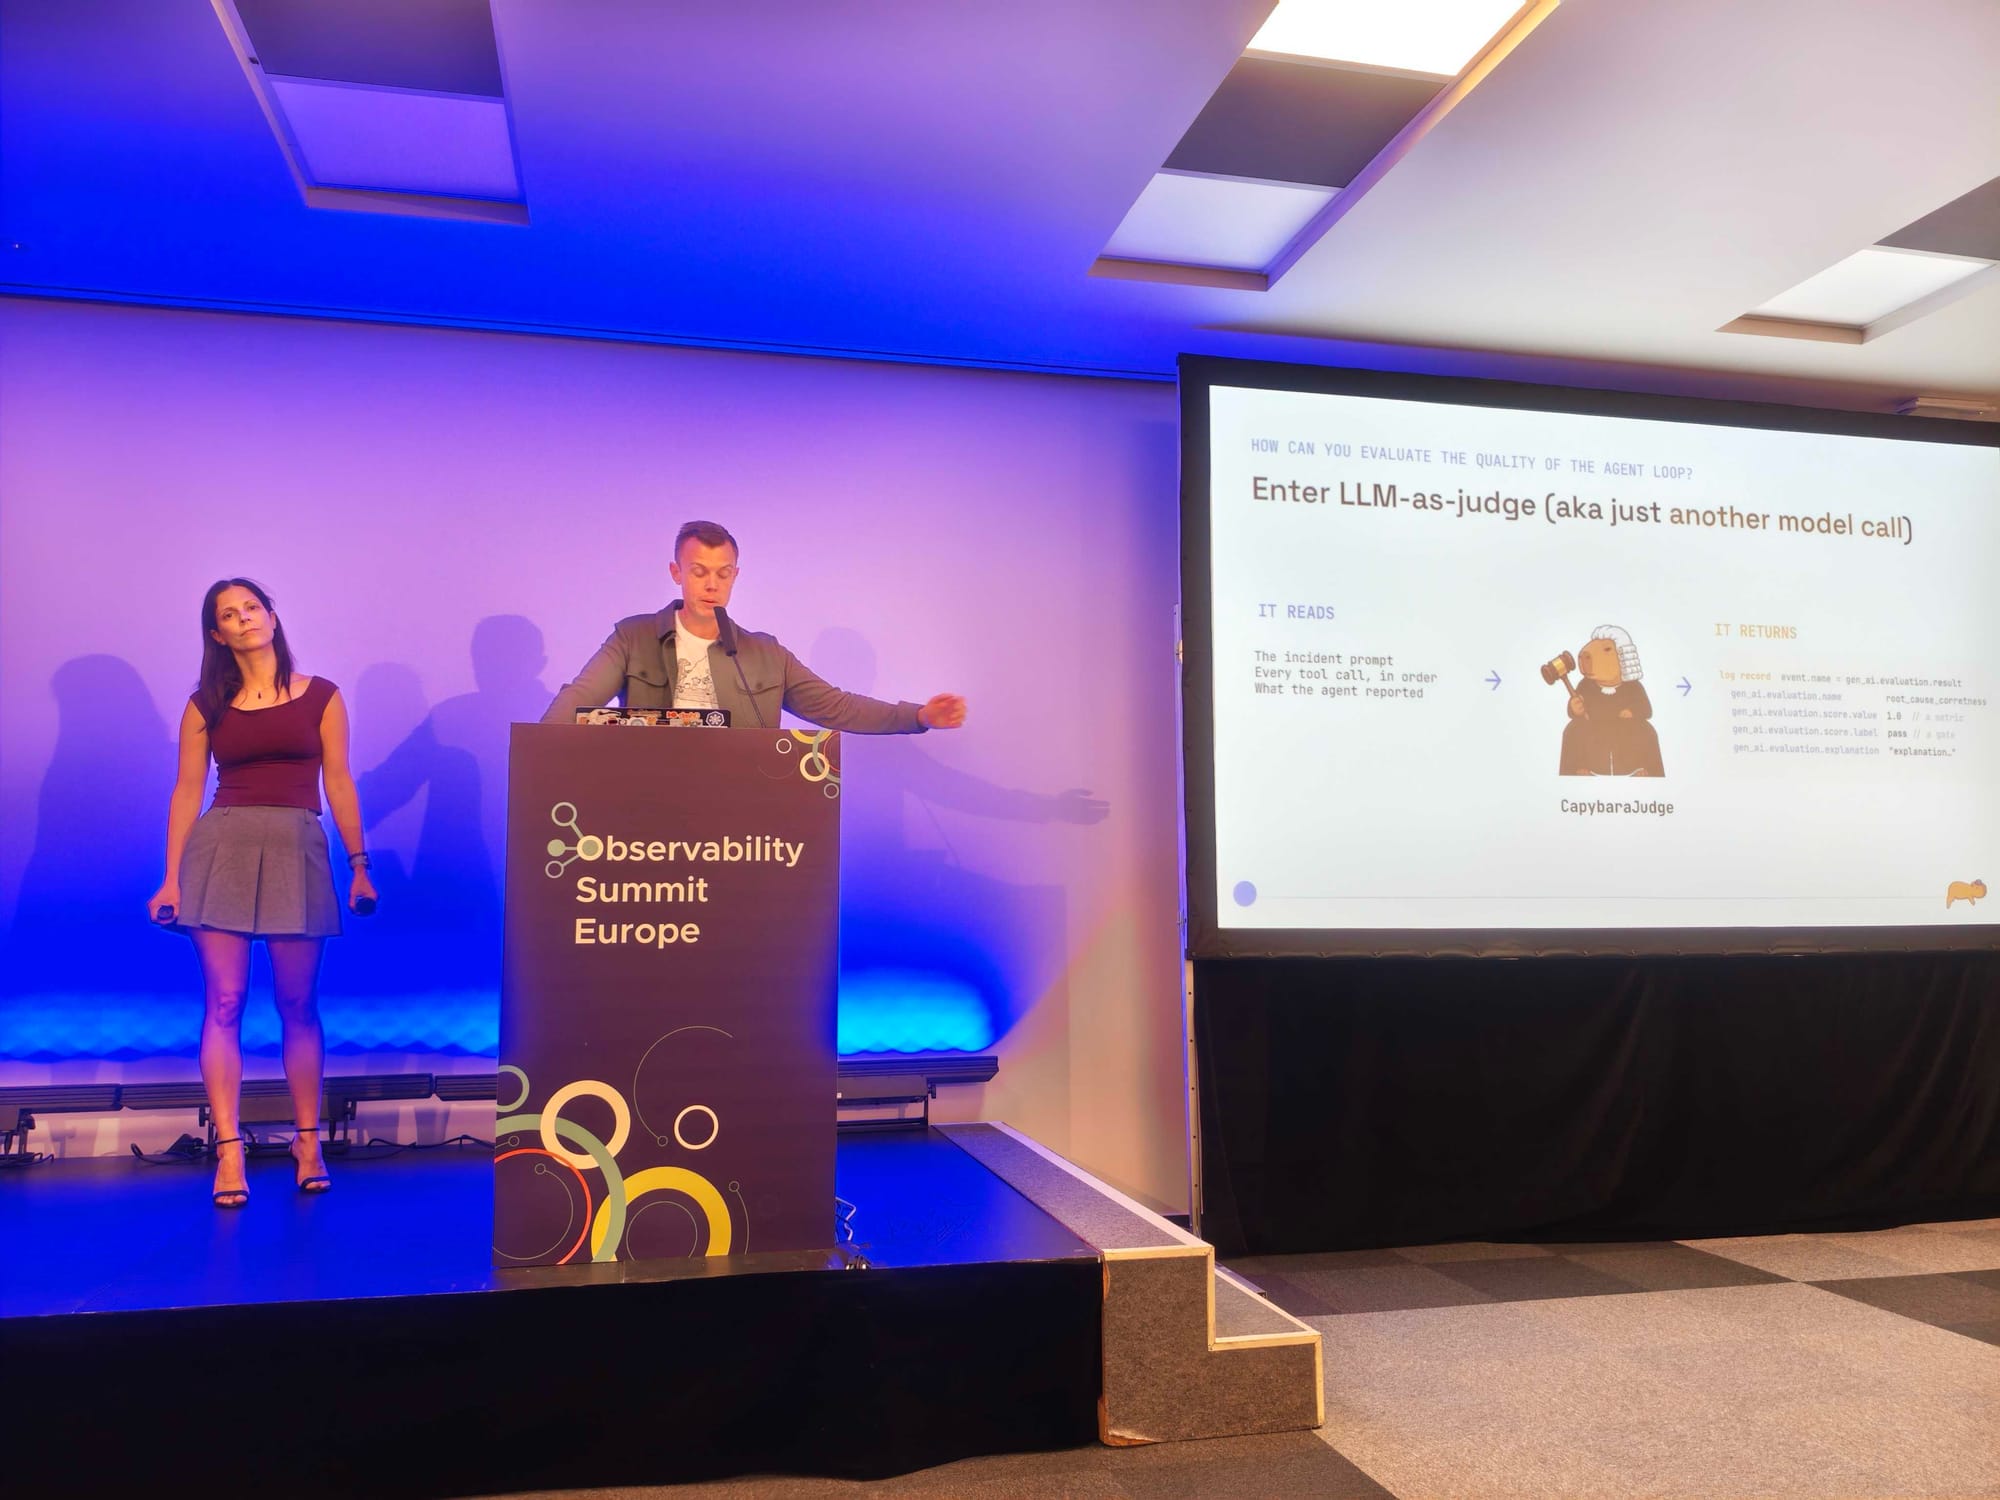
The telemetry can prove what the agent did, but not why. There’s no gen_ai.tool.call.reason, and the model doesn’t tell us everything. To judge whether the investigation was any good, we used LLM-as-judge, which is just another model call. It reads the incident prompt, every tool call in order, and what the agent reported, and returns a gen_ai.evaluation.result event with a score you can use as a metric and a label you can use as a gate.
The questions afterwards were about exactly this: how to observe agents, how quickly the different conventions are converging on OpenTelemetry, and, of course, the capybara, otter and beaver. The code is in the demo repository.
Henrik and Iris Dyrmishi, who hosted the day, closed the summit right after us.
In between the talks
The conversations between the talks are always one of my favourite parts of these events, and this one had plenty. It was great to see Juliano Costa, Henrik Rexed, Iris Dyrmishi, Diana Todea, Andrej Kiripolsky, Severin Neumann and many more.
At the reception I finally met John Hayes. I’ve followed his Observability 360 newsletter for a while, and we covered a lot of ground.
After the reception, Adriana, Henrik, Severin, Andrej, Iris and I went for dinner. Great company and interesting conversations.
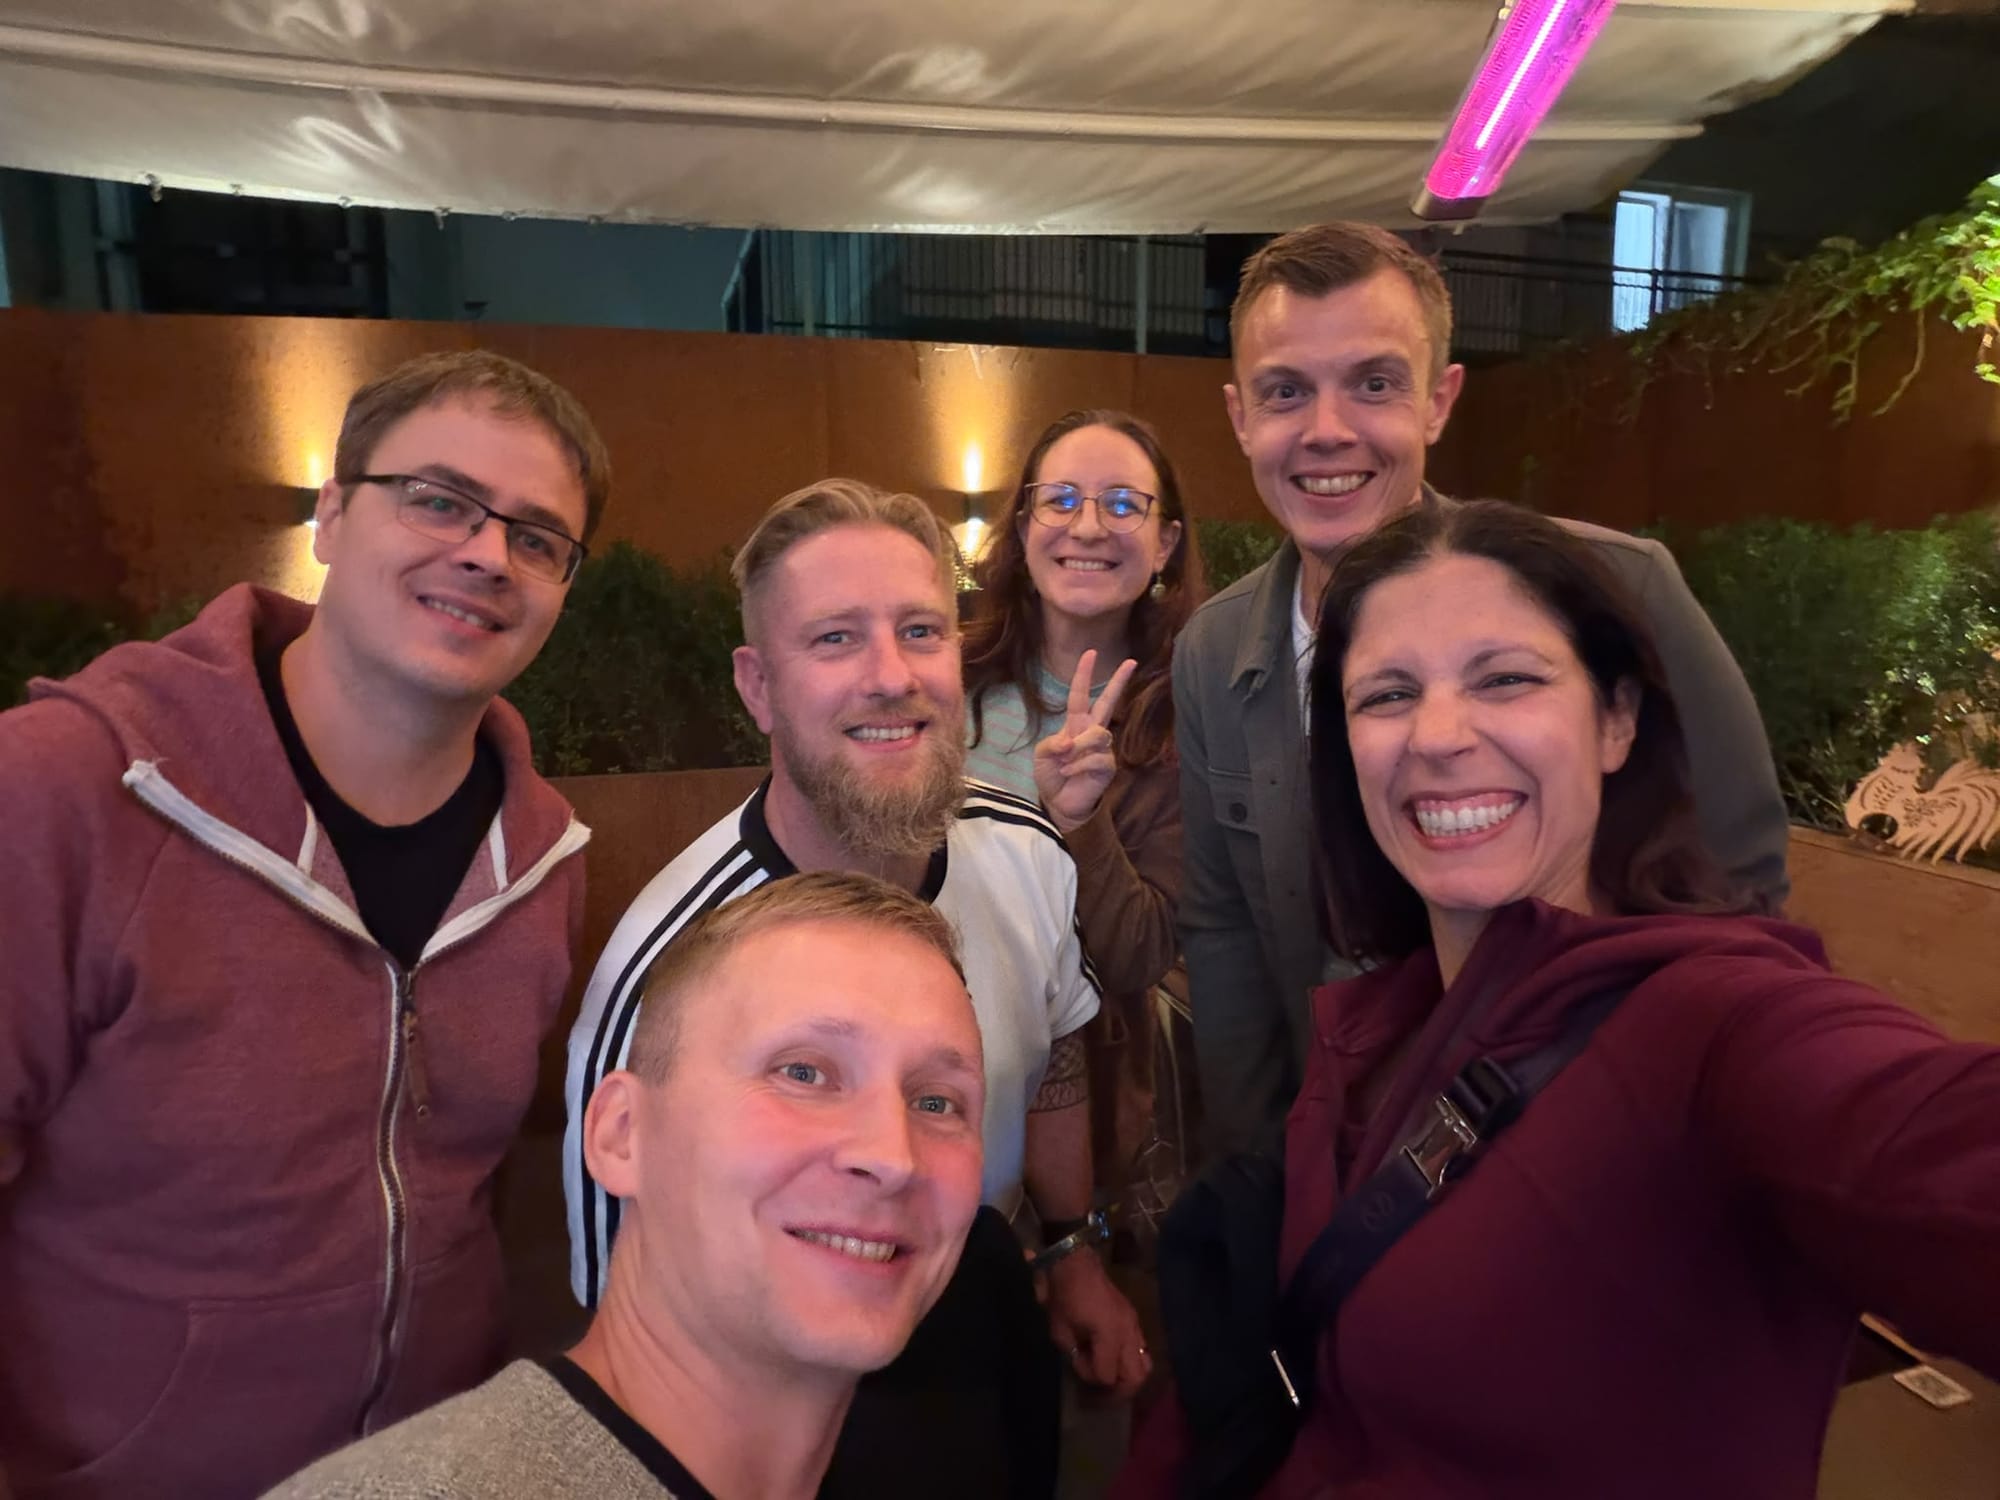
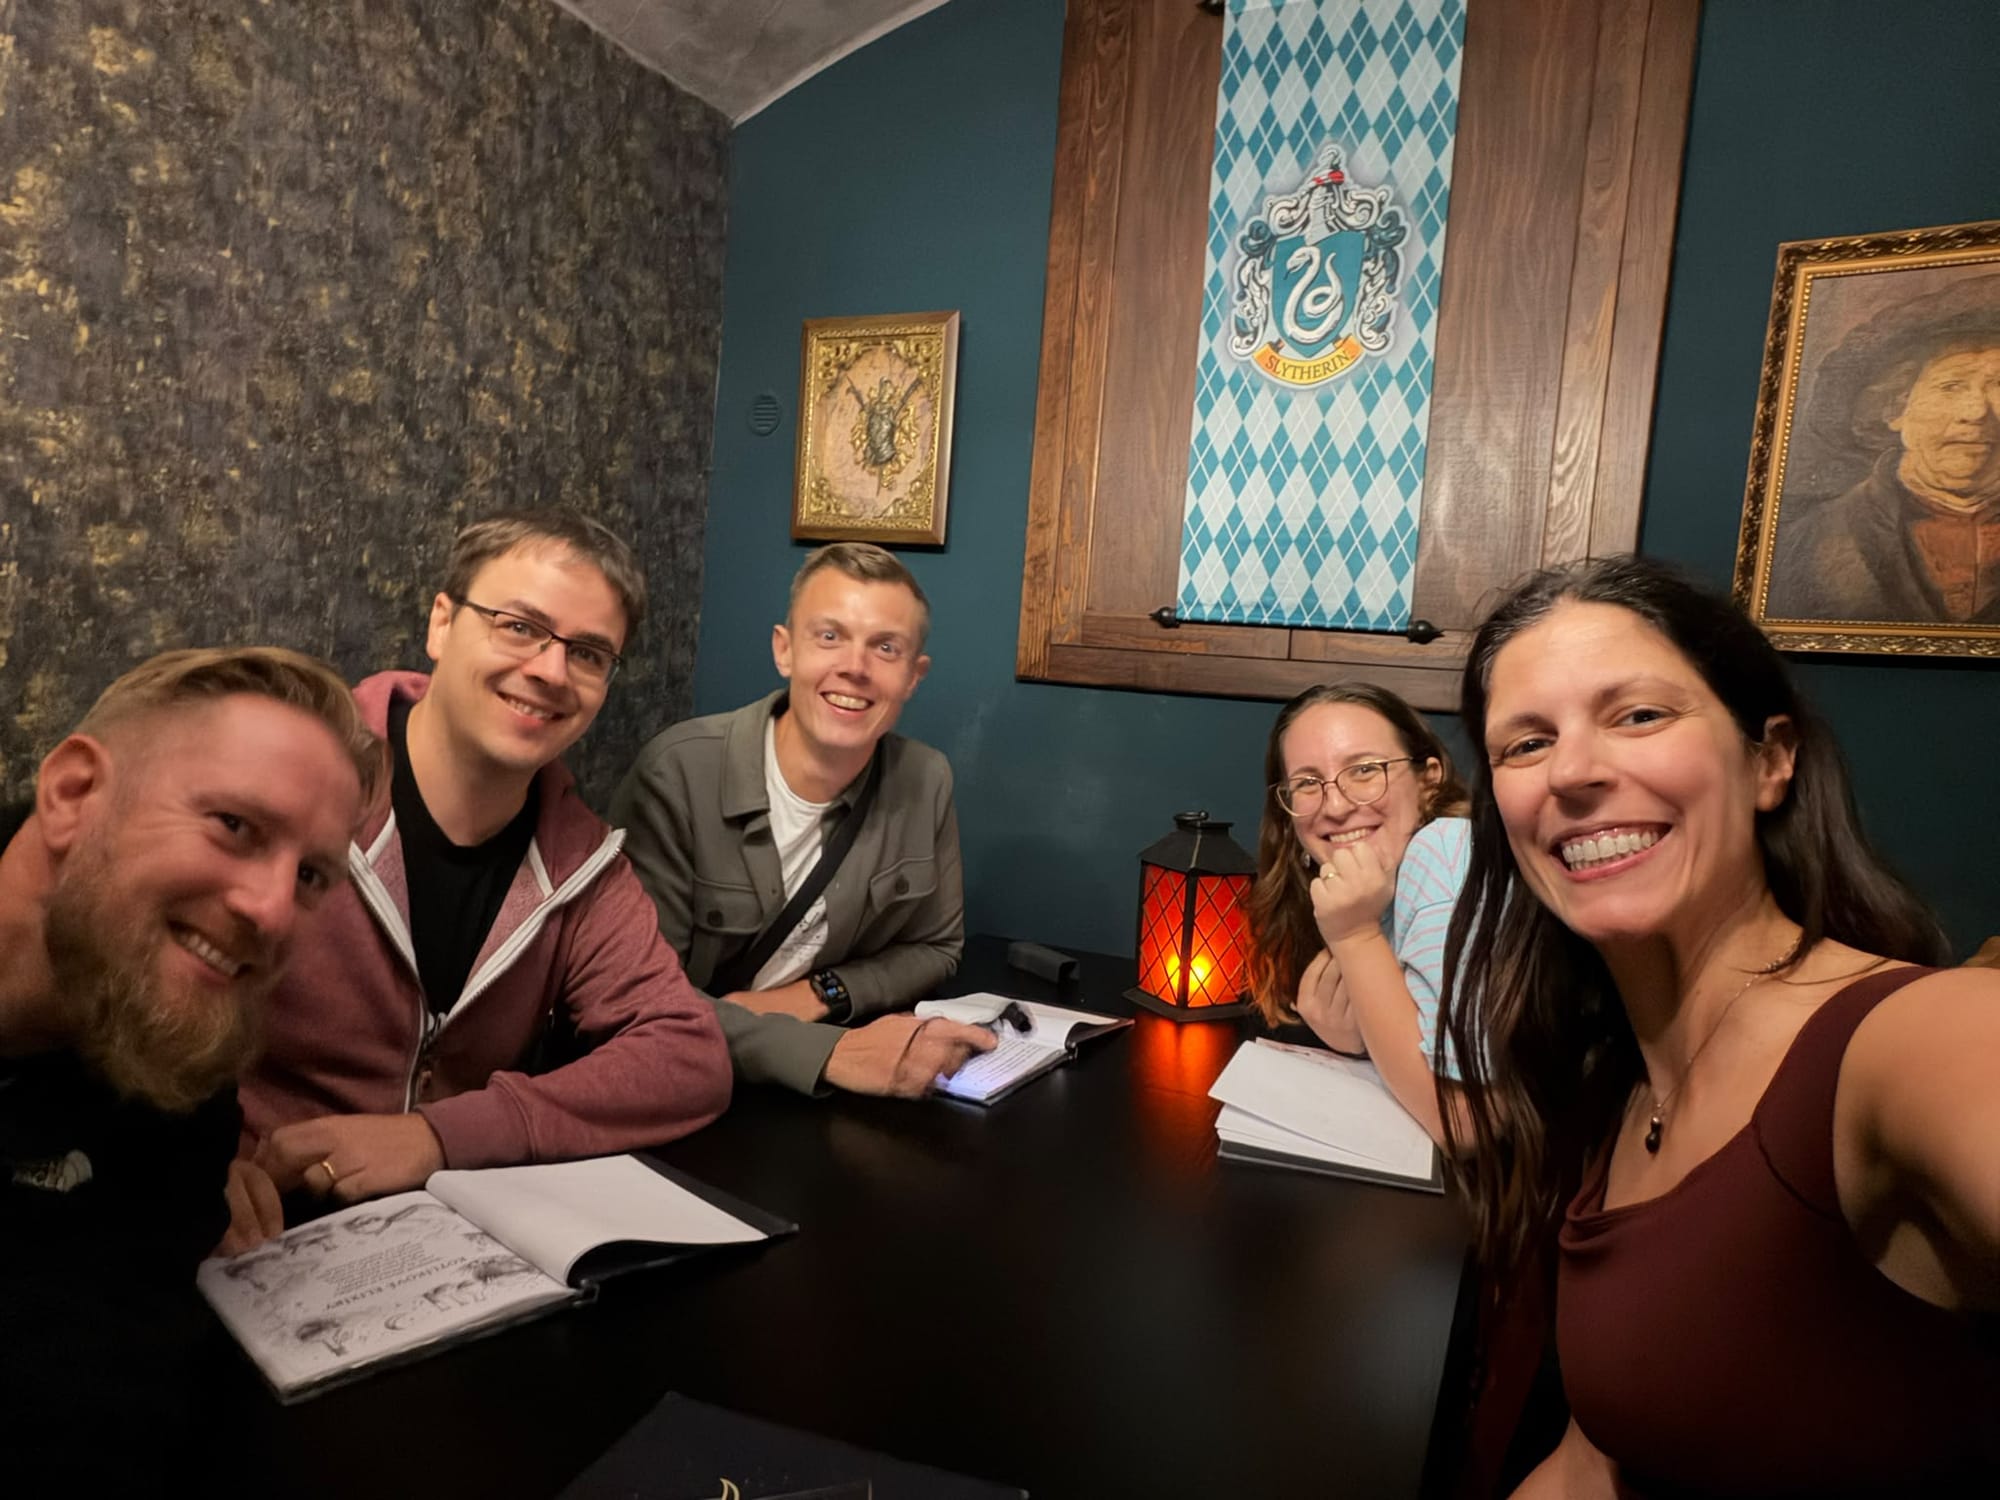
After dinner we moved on to cocktails at a rather weird Harry Potter-themed place.

Final thoughts
For a first edition, Observability Summit Europe was a good day. Most of the talks I saw assumed you already run OpenTelemetry, and asked how to run it well, keep it stable and extend it to agents. I like that the questions have moved on.
Thanks to Henrik and Iris for hosting, to everyone who stayed for the last session of the day, and to Adriana for another round of capybaras.
I’m staying in Prague for the rest of the week for Open Source Summit Europe. On Thursday, Adriana and I will give a slightly longer version of our talk. If you’re around, come and say hi.